Jev for SEO: Search Console API Triage with Claude Code
Average Google position went from 12.7 to 6.2 and clicks from 1.6 a day to 248 after a Search Console API audit with Jev and Claude Code. Here is how.
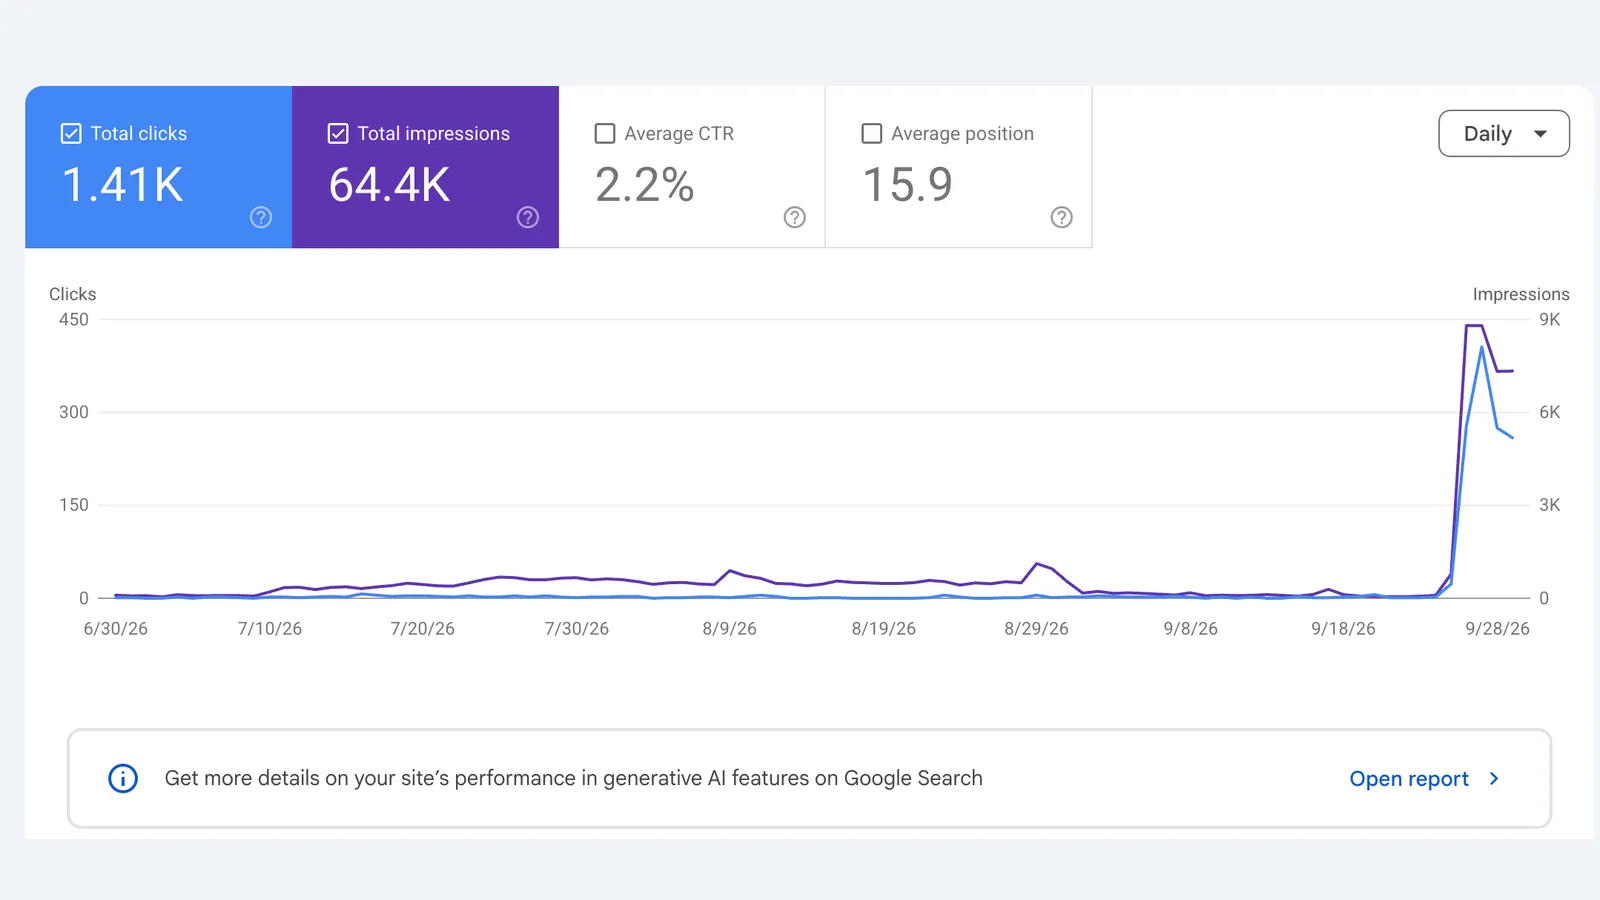
One of the sites I run earned 163 Google clicks across the 87 days to September 24, 2026. Over the following five days it earned 1,242, peaking at 406 clicks on September 27. Its average Google position went from 12.7 to 6.2, and the number of search queries it ranked on page one went from 49 to 1,518.
The week before, I used Claude Code, the Google Search Console API and TypeSafe’s Jev model to audit the site and fix what the data flagged. This post explains how that workflow is set up, the code behind it, the changes it produced, and what a follow-up data pull showed about which changes drove the increase in clicks.
What does each tool actually do?
I ended up with four tools, and each one does one job.
- Google Analytics 4 told me something was wrong. Organic sessions went 2,191 in June, 2,156 in July, 1,441 in August. That is a one-third drop in a month. Over the same period, AI-assistant referrals climbed from 55 to 275 to 410 over the same stretch, and about 88% of sessions were on desktop. For a consumer site, that desktop share was a warning sign worth investigating.
- The Search Console API told me where. The web UI gives you a queries table and a pages table, separately, and stops at 1,000 rows. The API gives you query and page joined, so you can see “this page is failing for this exact search”. My pull came back with 3,129 of those pairs.
- Jev sorted the mess. Jev is TypeSafe’s new “System One” model. Its documentation says it “evaluates a state and returns typed answers and probabilities”. It doesn’t write anything. You ask it yes or no questions and get back numbers.
- Claude Code did the actual work. It read Jev’s output, rewrote the titles, added redirects and links, and wrote itself notes on what to re-check later.
Why not just paste the CSV into a chatbot and ask it to “fix my SEO”? Because that returns prose, not data you can sort. Jev gave me a probability for every row, 1,161 rows in total, and I could sort and threshold them and check them by hand. The whole run was 281 Jev calls and cost me under five cents. Jev pricing is covered in more detail in my Jev cost breakdown.
Of all the Jev use cases people built in launch week, this SEO triage is the one I have tested personally, on my own site, and the results below come from my own Search Console data.
Why bother with the API instead of the export?
Because the export hides the one thing you need. A page with a bad click-through rate tells you nothing on its own. A page with a bad click-through rate for a specific query tells you exactly which title to rewrite.
Google’s searchanalytics.query reference lets you set rowLimit anywhere in a “valid range is 1–25,000”, and page past that with startRow. Ask for two dimensions at once and every row is a pair:
// POST https://www.googleapis.com/webmasters/v3/sites/{property}/searchAnalytics/query
{
  "startDate": "2026-01-19",
  "endDate": "2026-09-16",
  "dimensions": ["query", "page"],
  "type": "web",
  "rowLimit": 25000,
  "startRow": 0
}
The first real surprise came when I added device as a third dimension. Mobile clicked through at 2.71%. Desktop clicked through at 0.81%, and desktop had 36,129 of the impressions. On a consumer site that is upside down, and the most likely reason is that a lot of those desktop “searchers” weren’t people. Every CTR number I’d been staring at for months was being dragged down by them.
You don’t need Google’s SDK for any of this. My script signs a service-account JWT with Node’s built-in crypto, swaps it for a read-only webmasters.readonly token, and loops through startRow 25,000 rows at a time. It’s about 130 lines, comments included.
How do I set up the service account?
Setup is a one-time job:
- In Google Cloud, create a project, turn on the Search Console API and the Google Analytics Data API, and create a service account. Google’s service account overview explains how they work.
- Download the JSON key. Put it in a gitignored folder like
.secrets/and point a variable in.envat it. Add the gitignore rule before you copy the key in, not after. - In Search Console, go to Settings, then Users and permissions, and add the service account’s email. In GA4, add the same email as a Viewer.
- Write a tiny verify script that lists which properties the account can see. If you forgot a grant, it tells you which email to add instead of a bare HTTP 403.
- Pull at least 90 days of
query,pageandquery,page,device, and save the raw JSON so you can rerun things later.
What do I ask Jev about each search?
My first round of questions was useless, and the reason is the most useful thing in this post.
I asked Jev “would Google answer this query right on the results page?” It scored a textbook zero-click search at 0.43 and a search that converts at 47% at 0.39. The scores did not separate the two cases. Then I rephrased it as a question about the query itself (“is the thing this person wants a single short fact?”) and the same two rows came back 0.89 and 0.12.
So the rule is: ask Jev to judge text you hand it. Never ask it to predict what Google will do.
Here are two of the questions I ended up with:
import { noul } from '@typesafe-ai/sdk';

export const titlePromisesAnswer = noul(
  'Does the page title in `title` promise to answer the specific thing asked in `query`, using words the searcher would recognise as their own?',
);

export const isRightPage = noul(
  'Given its title and description, is the page in `url` the best page on this site to answer `query`?',
);
There are five in total: is this typed by a human, is the answer a single short fact, does the title promise the answer, is the description specific, and is this the right page. Each gives a probability. Plain code turns those into to-do lists:
| To-do list | Rule | Pairs | Impressions |
|---|---|---|---|
| Rewrite the snippet | top 20, zero clicks, weak title or description | 158 | 1,013 |
| Wrong page ranking | right-page probability under 0.4 | 194 | 815 |
| Snippet fine, still zero clicks | top 10, strong title and description | 254 | 2,037 |
The third row saved me the most time. If a page is in the top 10, has a good title, and still gets zero clicks, rewriting it won’t help. On my site those were mostly the desktop bot impressions. Polishing them would have been a waste of an afternoon.
A simple regex filter runs before Jev and removes pasted URLs and -site: operator strings. It costs nothing and is exact on those cases, so only the remaining rows go to the model.
What did Claude Code change?
Over three sessions (September 10, 12 and 19), working off those lists, Claude Code:
- Rewrote the weak titles using one simple pattern: start with the exact words people search, then add a number or the concrete task. My own data was clear that titles promising “a list of everything” or “what X is” got nothing.
- Redirected five dead URLs that were somehow still ranking, one of them at position 5.1, plus a duplicate calendar page into its newer version.
- Fixed my own brand search, where my about page was ranking above my homepage. The homepage got a clearer title and real links into the pages people were searching for.
- Cut the junk: about 100 thin tag and utility pages set to noindex, and the sitemap trimmed from 576 URLs to 472.
- Merged duplicate pages, eight URLs folded into one hub, and added the H1s that 31 pages were missing.
- Left notes for later: for every change, the baseline numbers, a date to re-check (28 days out), and the number that means “revert this”.
How much did rankings and clicks improve?
A lot. Here is the Search Console performance report for the period:
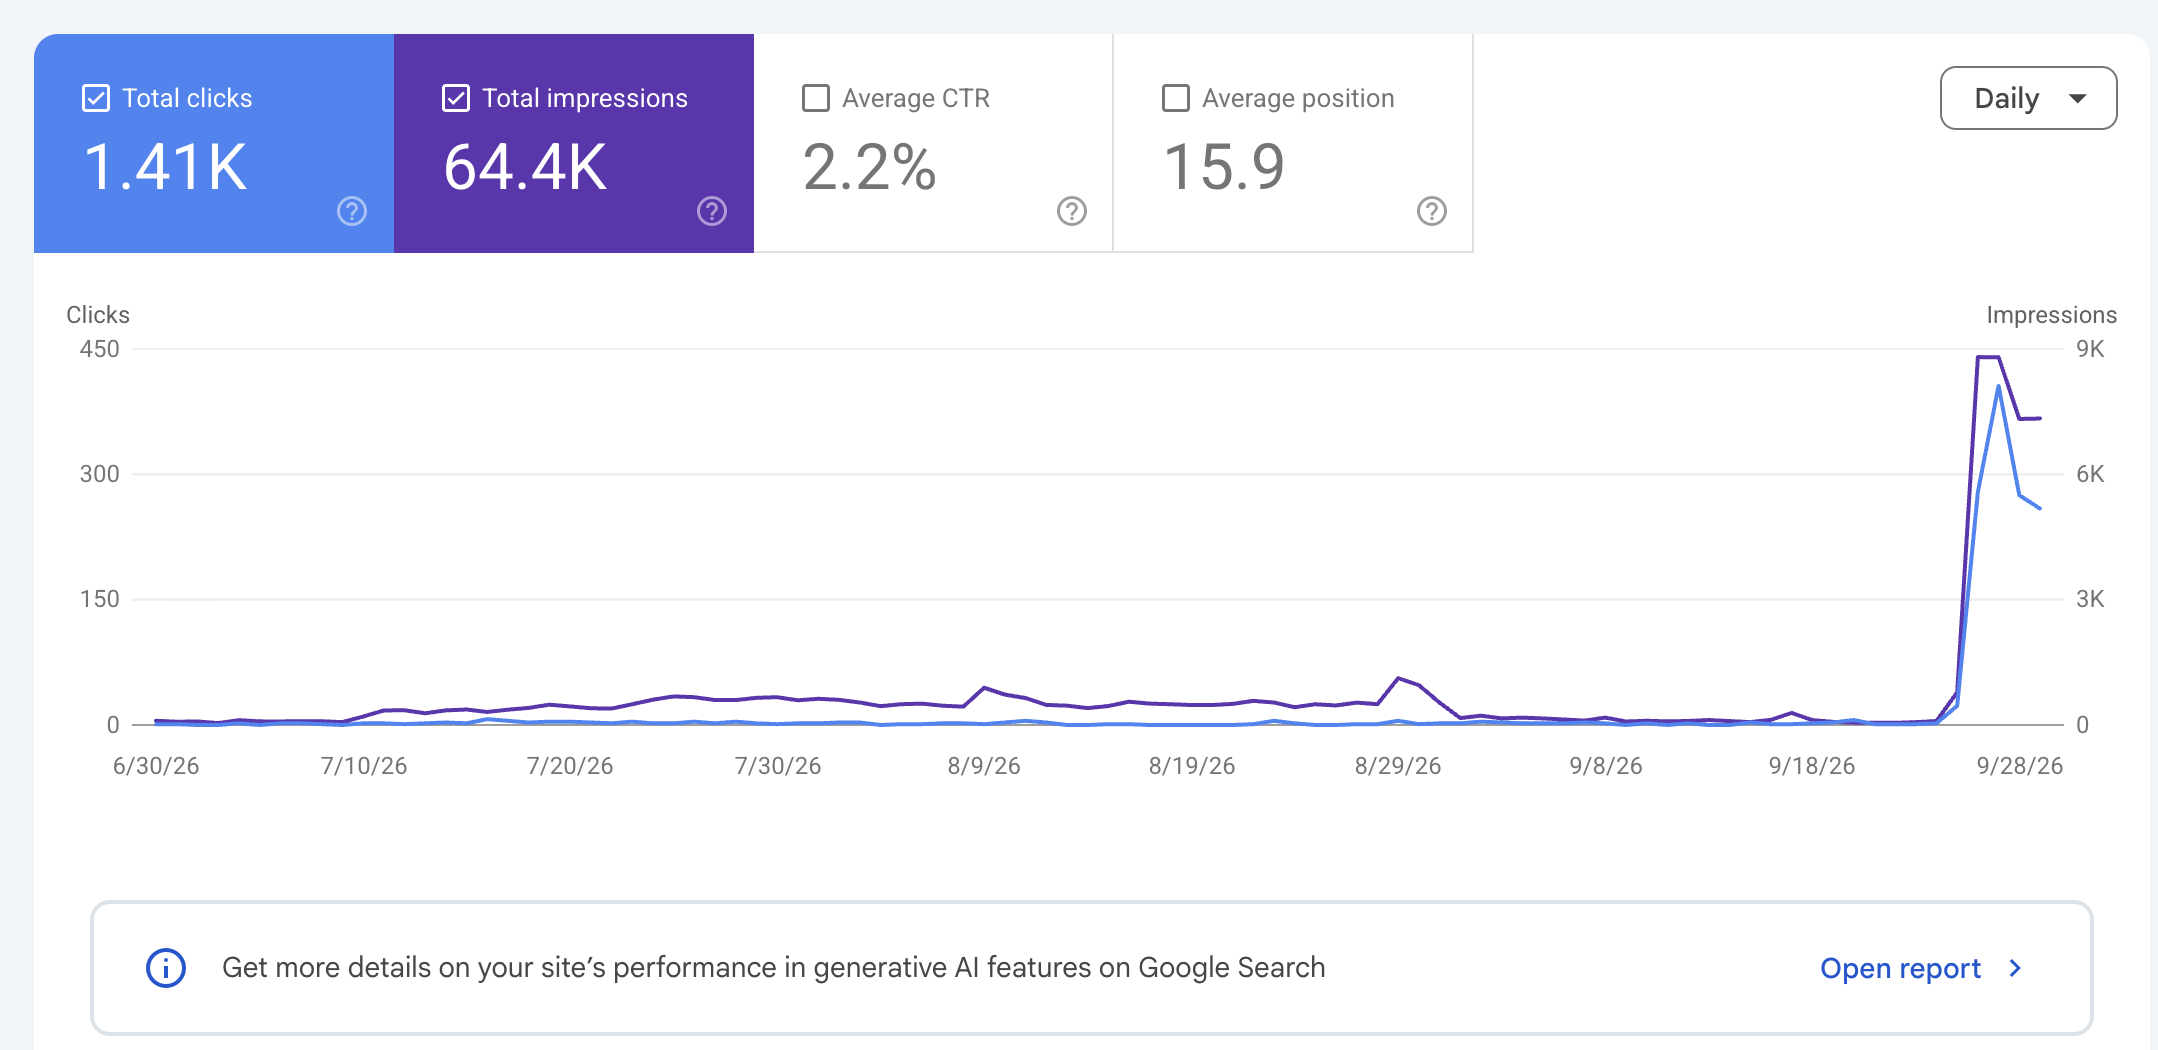
I ran the API again on October 3, broken down by date, page, query and device, to see how wide the improvement went. It was close to site-wide.
- Average position went from 12.7 to 6.2. That compares September 11 to 24 with September 25 to 29, weighted by impressions. Over the three months before, the site averaged 26.1, so it effectively moved from page three to page one.
- Queries ranking in the top 10 went from 49 to 1,518. Before, only 27% of the site’s impressions came from top-10 positions. After, it was 96%.
- Clicks went from 1.6 a day to 248 a day, a roughly 150x increase, and impressions went from about 100 a day to about 6,600.
- Desktop click-through went from 0.92% to 3.27%. That means real people were clicking, not just automated impressions.
The gains were not limited to one page. These are some of the biggest position moves among pages that had impressions in both windows:
| Item | Before (Sep 11 to 24) | After (Sep 25 to 29) |
|---|---|---|
| Entity page | #41.6 | #11.8 |
| Guide page | #31.6 | #5.7 |
| Category hub | #25.4 | #9.2 |
| Explainer post | #19.3 | #7.5 |
| Homepage | #17.6 | #5.9 |
| Resource hub | #16.9 | #6.9 |
| Ranking list | #14.4 | #9.6 |
Several of those pages went from zero clicks to their first real traffic. The resource hub went from 0 clicks to 14, the explainer post’s impressions went from 29 to 685, and the homepage, which my about page used to outrank, doubled its clicks in a third of the time.
Two new pages also did very well. A guide published September 23 and a post published September 26 answered questions people were searching that week, reached around position 4 within days, and took 67% of the clicks. Claude Code wrote those as well. The chart below splits them out, because the rest of the site matters just as much:
| Date | Two new pages | Rest of the site |
|---|---|---|
| 2026-09-20 | 0 | 6 |
| 2026-09-21 | 0 | 1 |
| 2026-09-22 | 0 | 1 |
| 2026-09-23 | 0 | 1 |
| 2026-09-24 | 0 | 2 |
| 2026-09-25 | 14 | 9 |
| 2026-09-26 | 184 | 95 |
| 2026-09-27 | 331 | 75 |
| 2026-09-28 | 183 | 92 |
| 2026-09-29 | 134 | 125 |
The blue line is the clearest sign that the site itself got stronger. Every other page together went from one or two clicks a day to between 75 and 125, and kept rising while the two new pages came down from their peak. The fresh pages brought searchers in, and a cleaned-up, properly linked site with better rankings across the board gave them somewhere to go next.
How do you try this on your own site?
- Look at GA4 first. Monthly organic sessions, the device split, AI-assistant referrals. If a consumer site is mostly desktop, don’t trust your impressions.
- Pull
query,page,devicefrom the Search Console API, at least 90 days. Keep the raw JSON. - Regex out the machine junk, then ask Jev a few small yes or no questions per pair. Phrase each one as a judgment about the text.
- Hand-label 20 to 30 rows and check Jev against them before trusting any cutoff. Make sure an obviously good row and an obviously bad row land far apart, not just that the average looks fine.
- Let Claude Code work only the rewrite and wrong-page lists. Leave the “fine snippet, zero clicks” pile alone.
- Write down a baseline and a revert line for every change, then pull the same data again in 28 days.
- Keep publishing for what people are searching right now. Better rankings across the site and fresh pages for current searches worked together.
If you’re setting up the Claude Code side from scratch, my Claude Code harness guide covers skills, hooks and subagents. If you’d rather plug tools in than maintain a script, the MCP servers worth installing explains how MCP servers hook into Claude Code, and there are community Search Console servers that work the same way. For the other Jev use cases people have built, from routers to code reviewers, see what 562 Jev demos built.
What tripped me up?
- Bot impressions distort every ratio. CTR, “high impressions, low clicks” lists, impression growth: all of it lies when most impressions aren’t people. Split by device before you believe any of it.
- Asking Jev to predict Google gave noise. It isn’t trained on how Google behaves. Ask about the text instead.
- Rating scales flatten out. I tried a 1 to 4 title-quality score and got 2.87, 2.84 and 2.77 on three very different titles. Several yes or no questions combined in code worked far better.
- Site totals hide the detail. After any jump, pull the data by date, page and query so you can see which pages actually moved.
Sources
Google (2026). Search Analytics: query. Search Console API documentation. https://developers.google.com/webmaster-tools/v1/searchanalytics/query
Google (2026). Query your Google Search analytics data. Search Console API guide. https://developers.google.com/webmaster-tools/v1/how-tos/search_analytics
Google Cloud (2026). Service accounts overview. IAM documentation. https://cloud.google.com/iam/docs/service-account-overview
Google (2026). Google Analytics Data API. Developer documentation. https://developers.google.com/analytics/devguides/reporting/data/v1
TypeSafe AI (2026). System One. Jev documentation. https://docs.typesafe.ai/concepts/system-one
Capital & Compute (2026). First-party Search Console API pull and Jev triage of a site under management (September 19 and October 3). Author data and screenshot; aggregates recorded in the claims ledger.