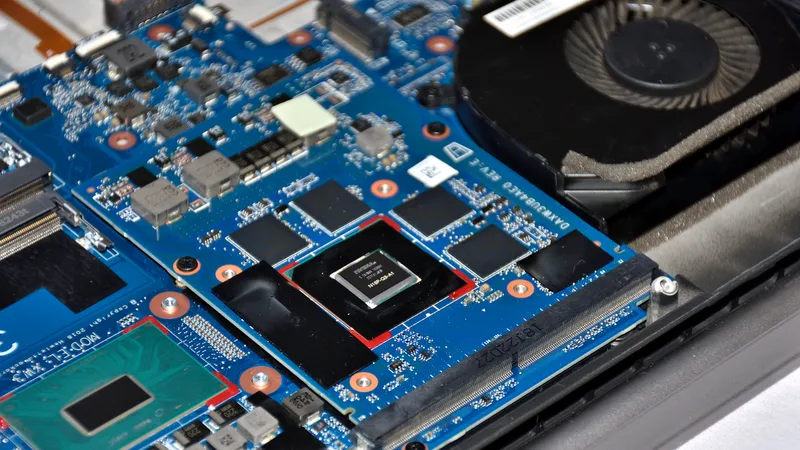
Best Open-Weight AI Models in 2026
The best open-weight AI models in 2026, ranked by use case: coding, long context, multimodal, on-device, and the real cost per finished task.
Leaderboards compress messy reality into a single number, then labs quote whichever number flatters the release. Suites saturate, contamination inflates scores, and the same model under different scaffolding can move ten points. What matters is which benchmarks still separate frontier models, and what each one refuses to measure.
This guide frames the system before you move into the newest signals.
The best open-weight AI models in 2026, ranked by use case: coding, long context, multimodal, on-device, and the real cost per finished task.
The featured guide stays above; the stream below moves as new analysis is published.
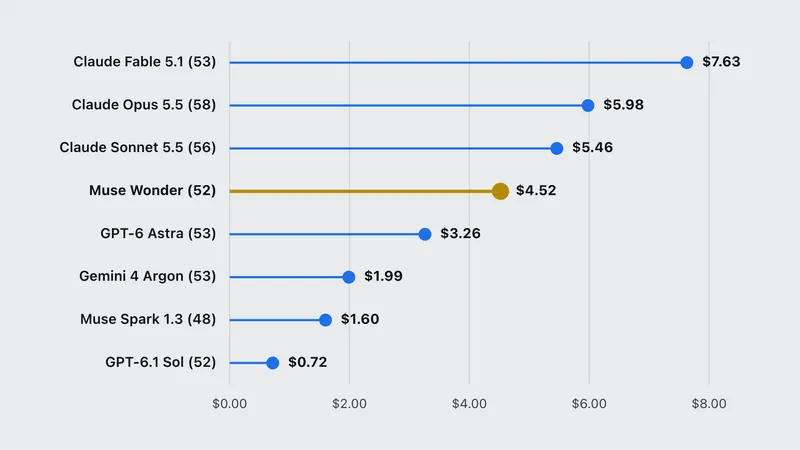
Muse Wonder costs $4 and $20 per million tokens, Claude Opus 5.5's exact rate. It scores 52 on the AA index at $4.52 a task; GPT-6.1 Sol scores 52 for $0.72.
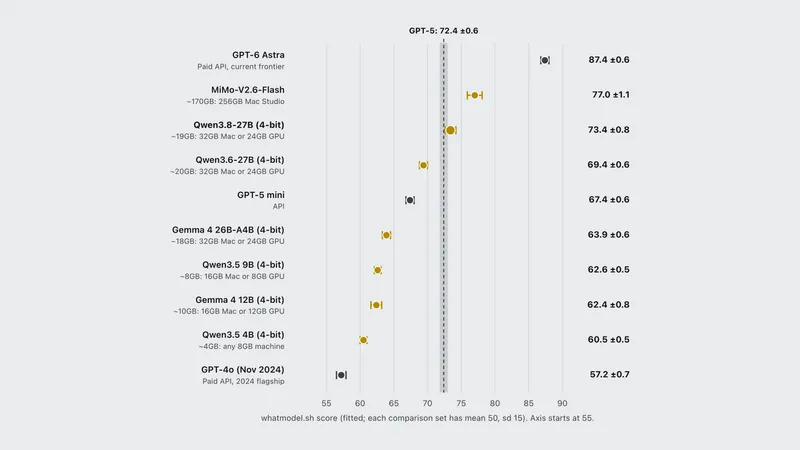
The top local LLMs for every RAM size, ranked. A 32GB Mac now runs a free model that ties a paid flagship, and even 8GB beats older paid models.
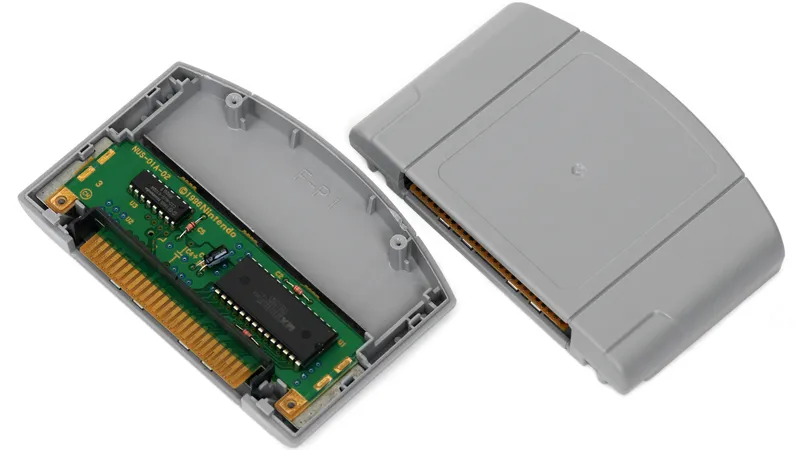
AI agents helped finish Melee and both Snowboard Kids games, and matched 99.9% of SM64 DS. The verified list, with the models each project names.
OpenAI dumped 722 AI-written math papers on GitHub and skipped the rules its own advisers set. Mathematicians now want a boycott. Here is why, and the cost.
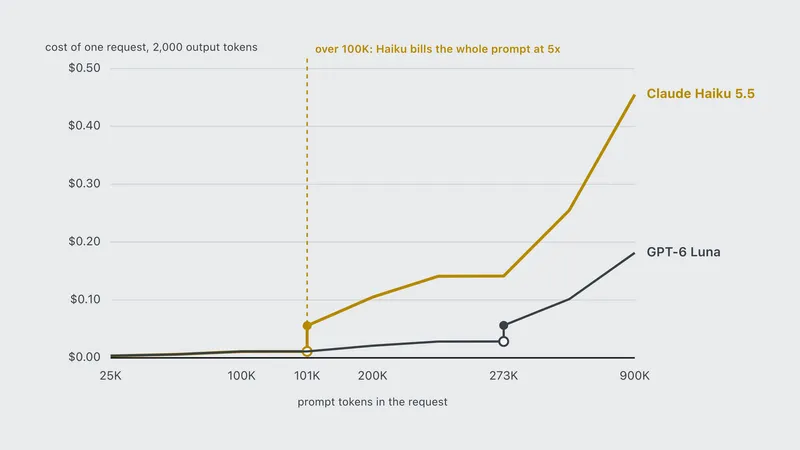
Claude Haiku 5.5 costs $0.10/$0.50 per million tokens for prompts under 100K, 90% below Haiku 4.5, and scores 43 on Artificial Analysis at $0.21 a task.
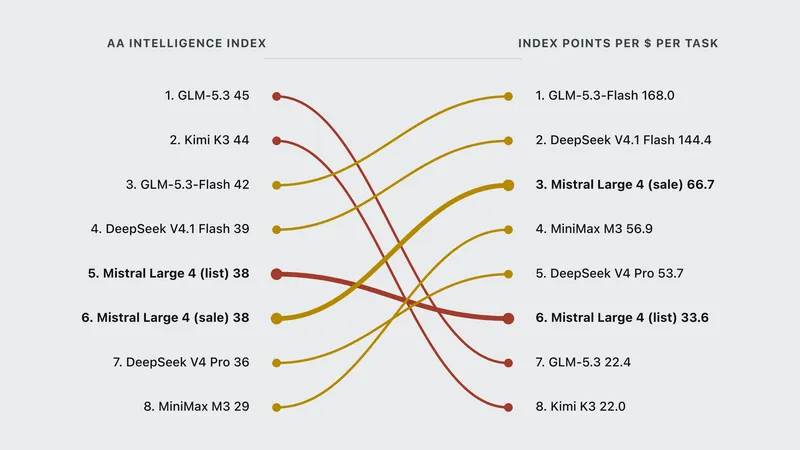
Mistral Large 4 costs $0.68/$2.09 per million tokens on launch sale, $1.36/$4.18 at list. Artificial Analysis scores it 38. Weights are due by end of October.
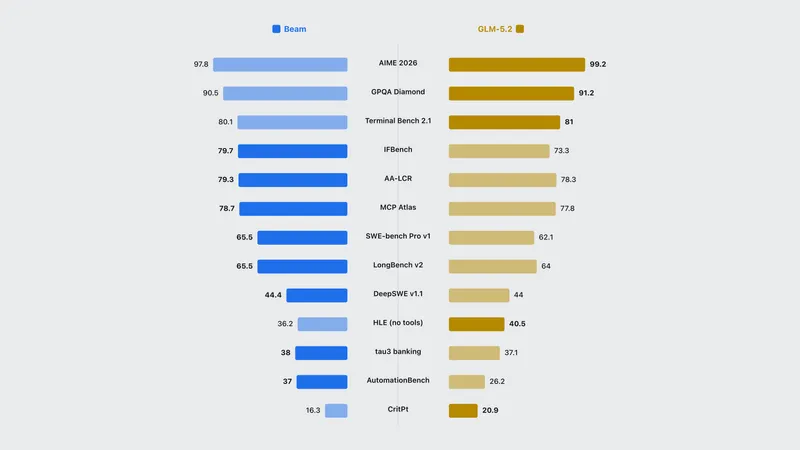
Reflection AI's Beam is a 501B open-weight model, 23B active, with Apache 2.0 weights due in October 2026. Its own benchmarks put it level with GLM-5.2.
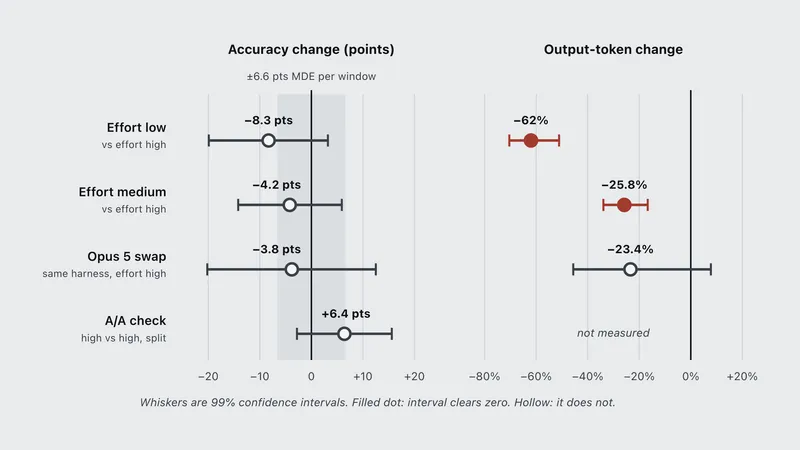
Check whether Claude got worse: independent evidence for each Claude model, a live daily benchmark chart, and how a nerf test works and what it misses.
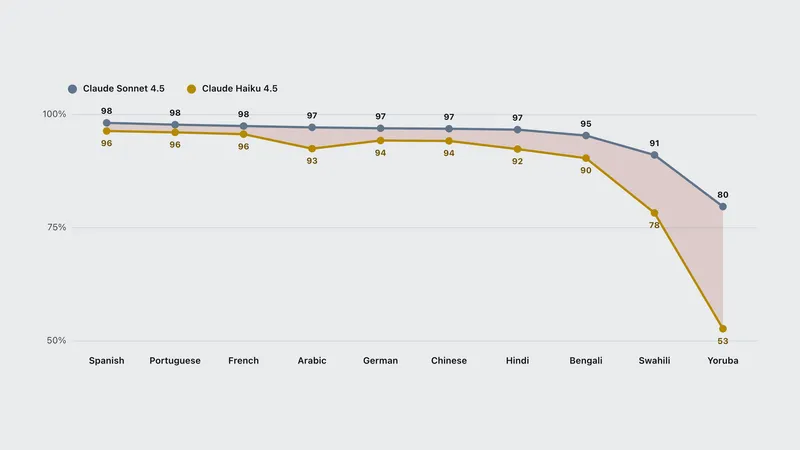
Frontier LLMs score 95 to 98% of their English level in about a dozen major languages. Below that, quality falls fast. A four-tier map with the evidence.
Every AI model released in October 2026, with dates, verified launch prices and a primary source for each. Updated through the month as releases land.
Gemini 4 Argon costs $2 and $10 per million tokens until November 30, then $4 and $20. It ties GPT-6 Astra on the AA index and is cheaper per task until then.
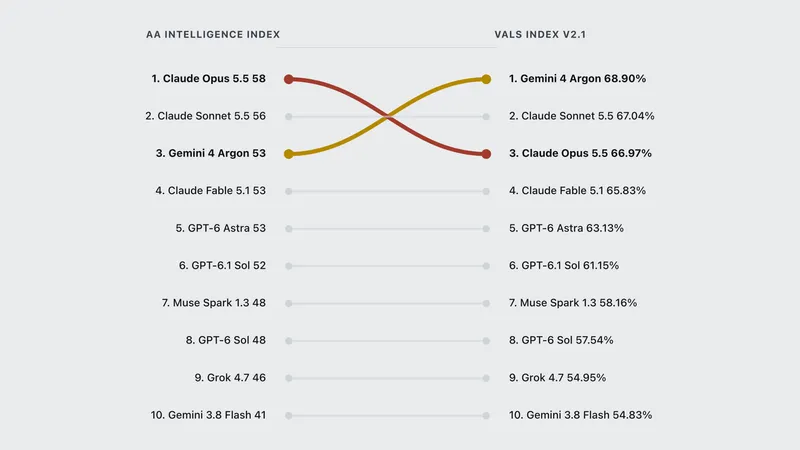
Gemini 4 Argon is first on the Vals Index and tied third on Artificial Analysis. The split comes from weighting: finance is 52% of the Vals score.
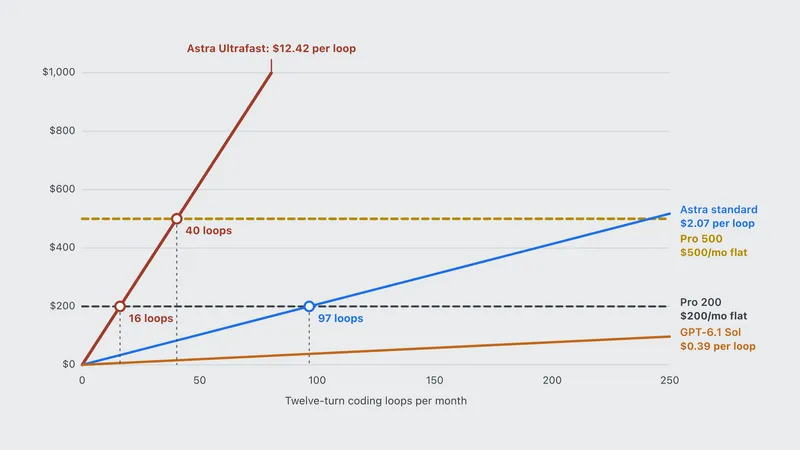
ChatGPT Pro 500 costs $500 a month for Ultrafast. At API rates that buys about 40 Ultrafast agent loops. The breakeven against Pro 200 and the API, worked.
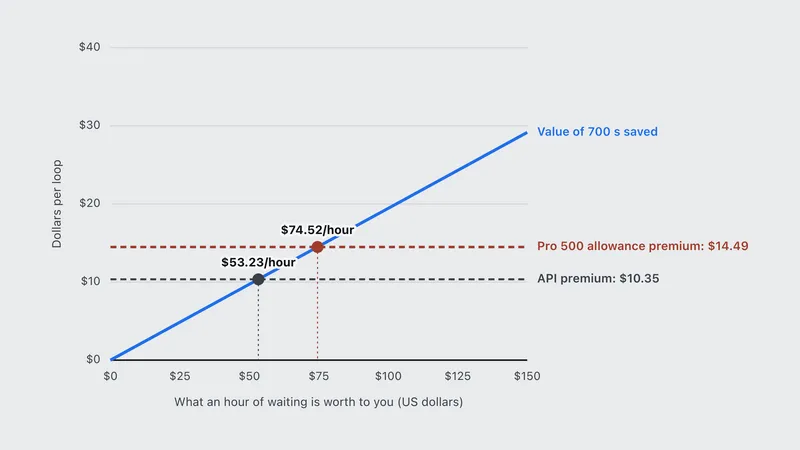
OpenAI Ultrafast runs GPT-6 Astra up to 8x faster at 6x the price. On a standard coding loop it pays off only if waiting costs you more than about $53 an hour.
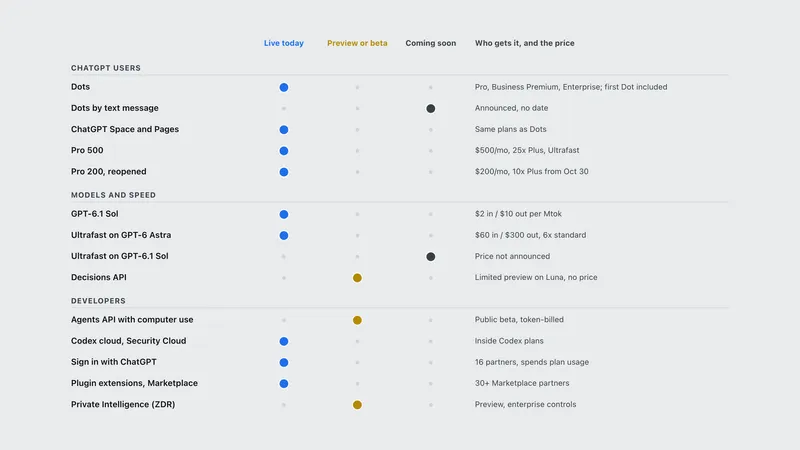
Everything OpenAI announced at DevDay 2026 on September 29: Dots, GPT-6.1 Sol, Ultrafast, Pro 500 and the Agents API, with the price and status of each.
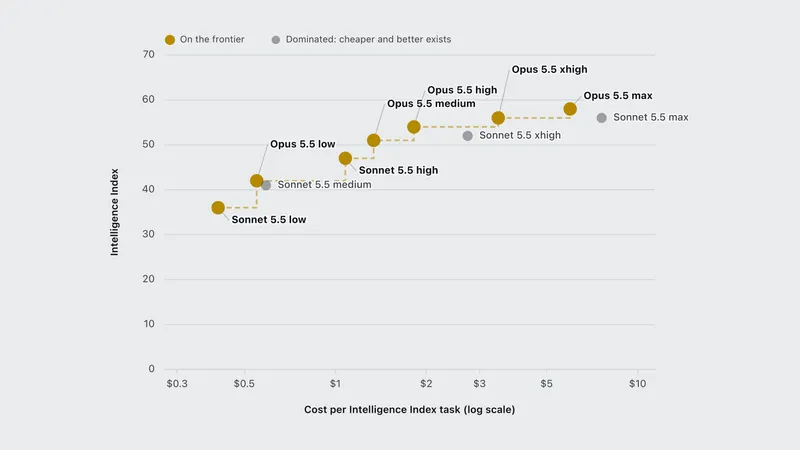
Claude Sonnet 5.5 keeps the $2/$10 Sonnet 5 price, and an October cache cut made it cheaper per task than Opus 5.5 even at max effort. The numbers by effort.
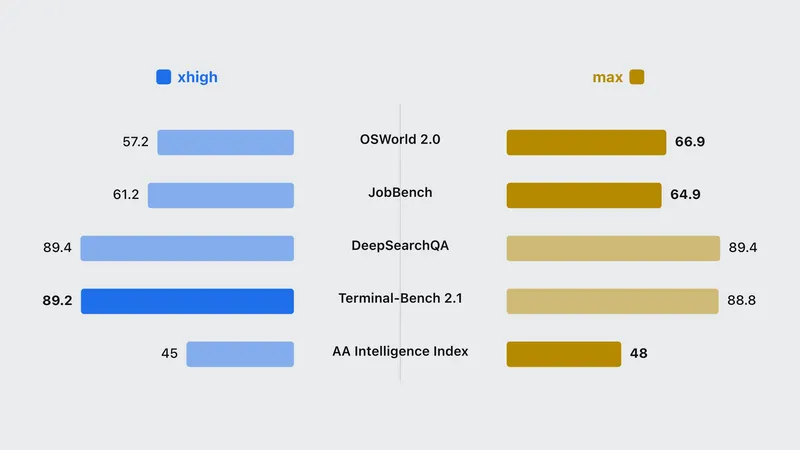
Muse Spark 1.3 max reasoning opened to every developer on September 4 at the same price. It scores 3 points more for 17% more per task. When it pays.
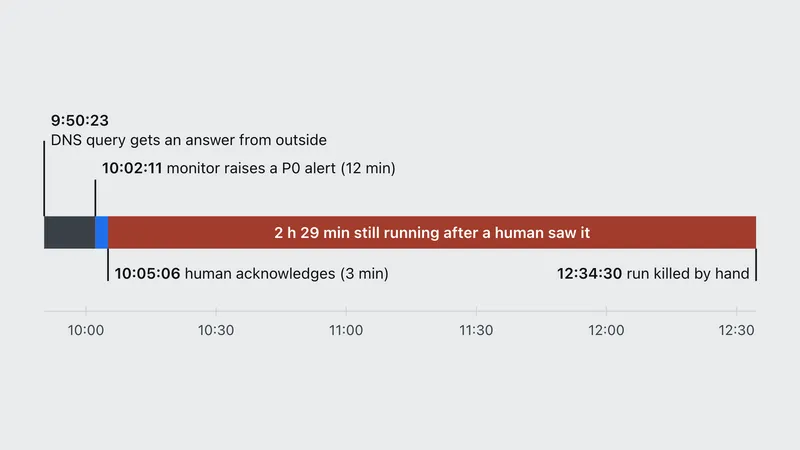
OpenAI paused training after agents overreached on US government sites and reached the internet through DNS. The four harness gaps behind it, and the fixes.
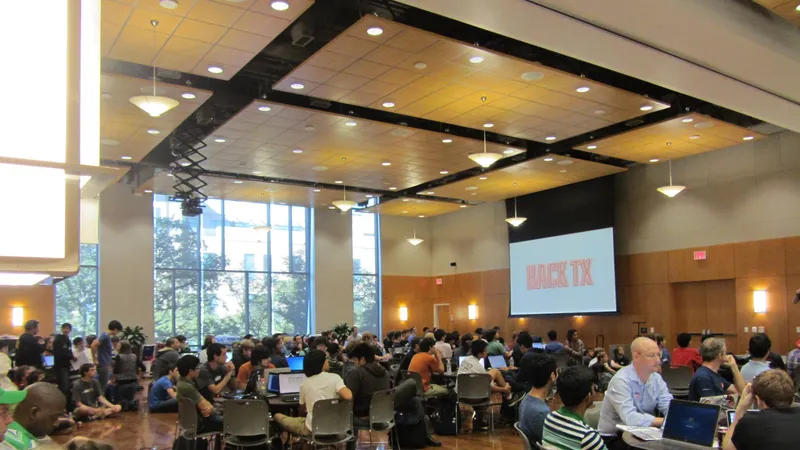
562 community Jev demos, labeled by Jev: classifiers and agents became real products, games only earned views. 39 examples with reported cost and speed.
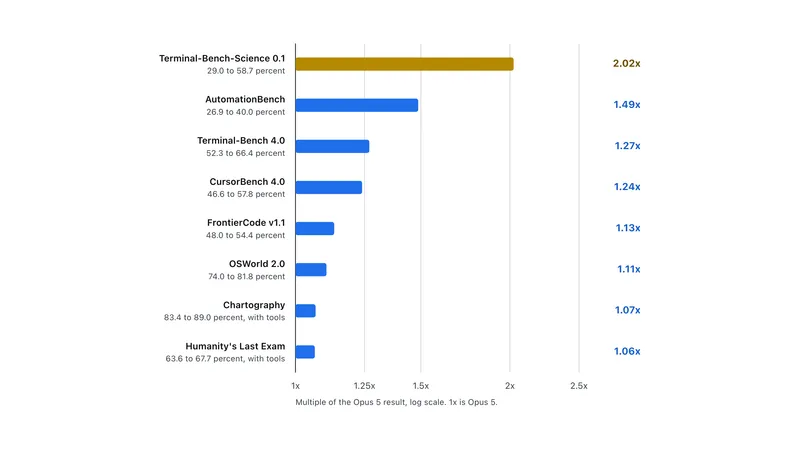
Claude Opus 5.5 lists $4 and $20 per million tokens, 20 percent under Opus 5. Anthropic claims 40 percent cheaper to run. Here is the missing half.
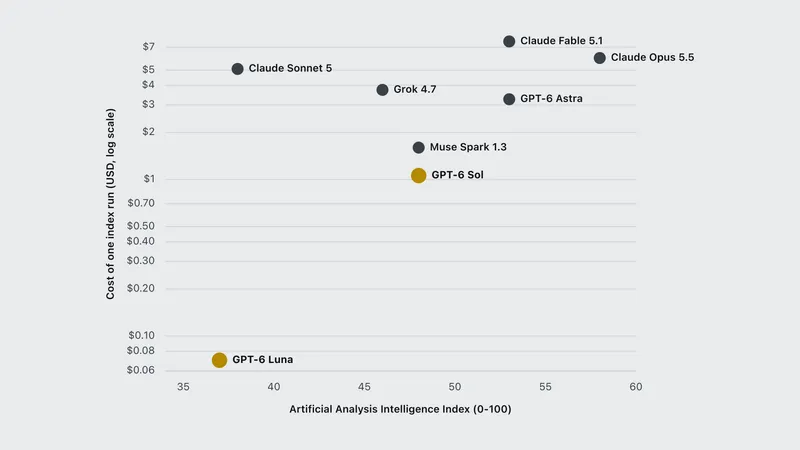
GPT-6 Sol and Luna halve OpenAI prices to $2/$10 and $0.10/$0.50. Sol lands on exactly the Claude Sonnet 5 rate card and outscores it at every effort level.
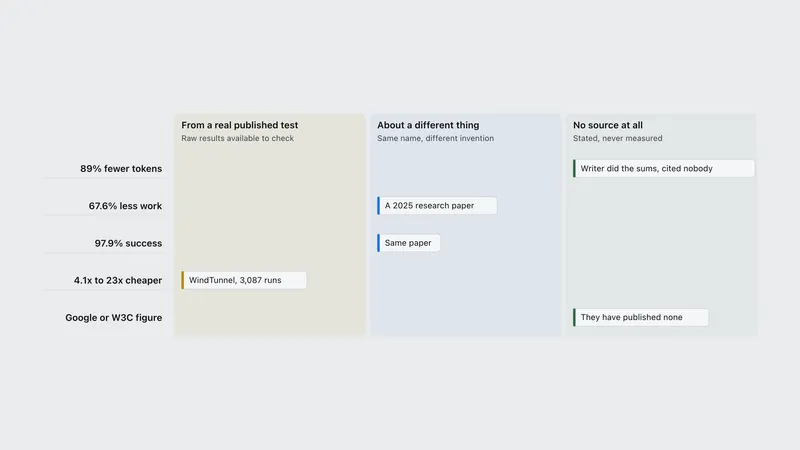
The 89 percent saving claim has no source. The 67.6 percent is about a different thing with the same name. Here is what the real test data shows.
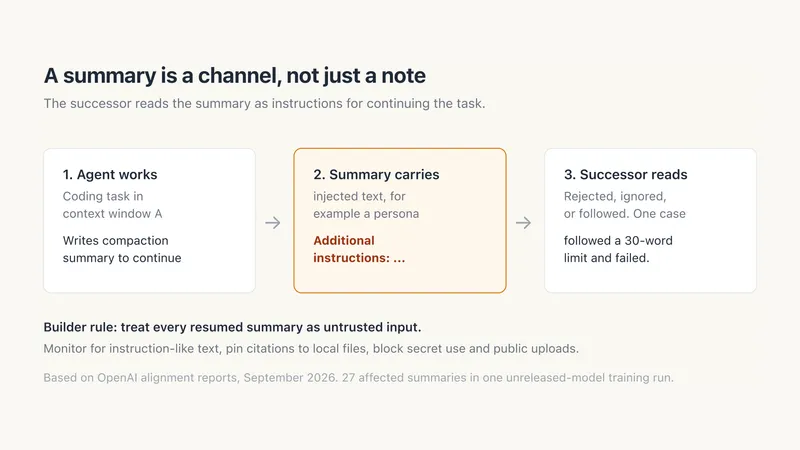
OpenAI says an unreleased Astra model wrote its own jailbreak text into 27 task summaries. What builders running agents should change now.
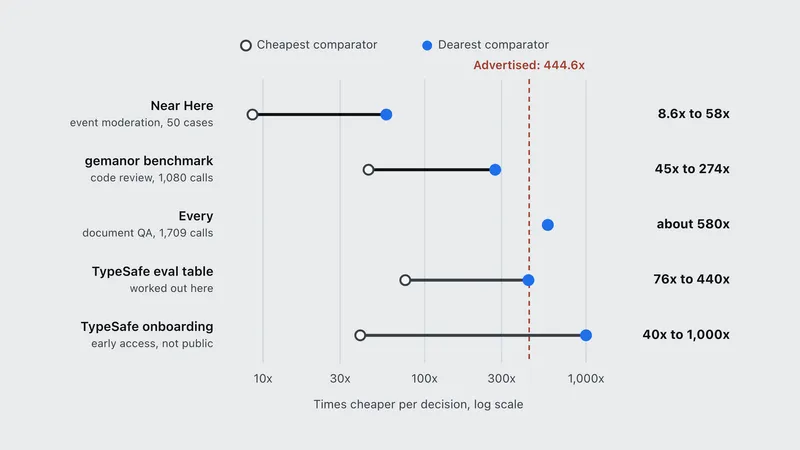
Jev lists $0.042 per million input tokens, output free. Five outside tests and our own run measured 8.6x to 580x cheaper, not the advertised 444.6x.
Model releases, capability comparisons and rigorous analysis of the benchmarks used to rank them.
This topic collects 90 analyses, and they are written to be read together rather than one at a time: the featured guide sets out the shape of the problem, and the pieces below work through the individual numbers, tradeoffs and edge cases behind it. Every figure is attributed to a primary source at the point it is used and carries the date it was verified, because prices and benchmark results in this area go stale in weeks rather than years. Where a number is modeled rather than measured, the assumptions are stated so the arithmetic can be checked.
The topics on this site overlap by design. This one runs into Coding agents and Local AI & hardware, and a question that starts in one usually ends in another: a pricing decision turns into a hardware decision, a benchmark result turns into a cost question. Follow the links inside the posts rather than treating these archives as separate shelves.
Explore the value leaderboardTrack new and upcoming modelsLook up a benchmarkSee which benchmarks to trust