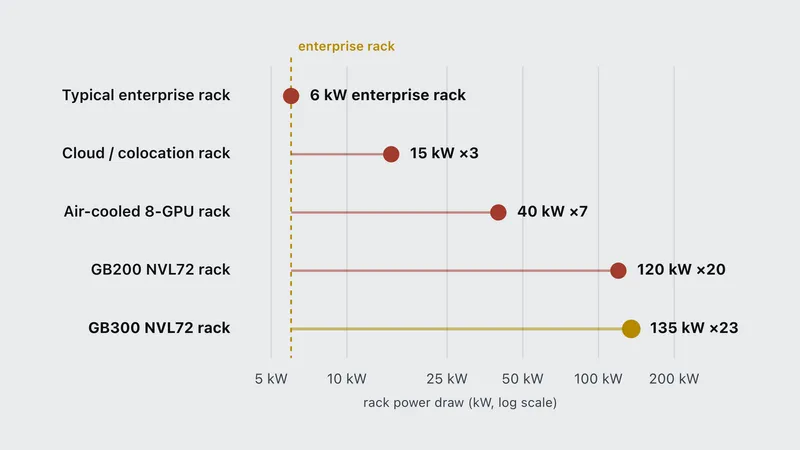
What Is an AI Data Center? Cost, Power, and Scale
An AI data center explained: how it differs from a traditional data center, what it costs per megawatt, and why power is the binding constraint.
Behind every model sits a physical stack measured in gigawatts, substations, GPUs and construction schedules, and a financial one measured in debt, leases and depreciation assumptions. Capacity announced today energizes years out, so the distance between what is promised and what is running is where the interesting numbers live.
This guide frames the system before you move into the newest signals.
An AI data center explained: how it differs from a traditional data center, what it costs per megawatt, and why power is the binding constraint.
The featured guide stays above; the stream below moves as new analysis is published.
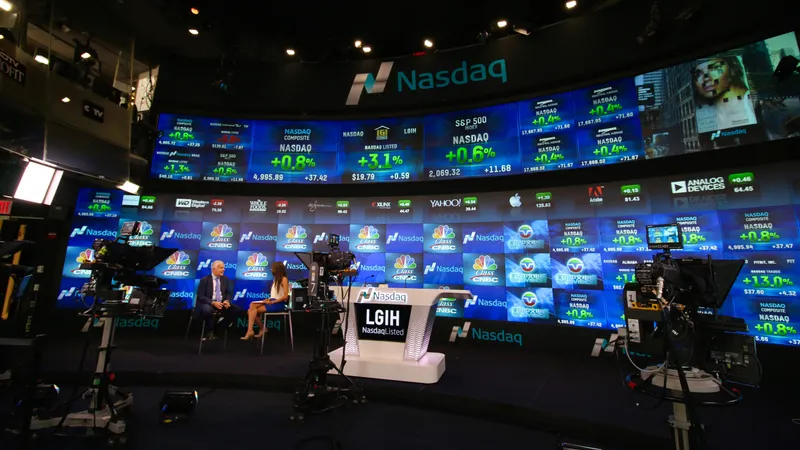
Anthropic's IPO prospectus shows $7.33B spent on compute in 2025 and $518B in obligations ahead, 113 times its revenue. Here is who it is owed to.
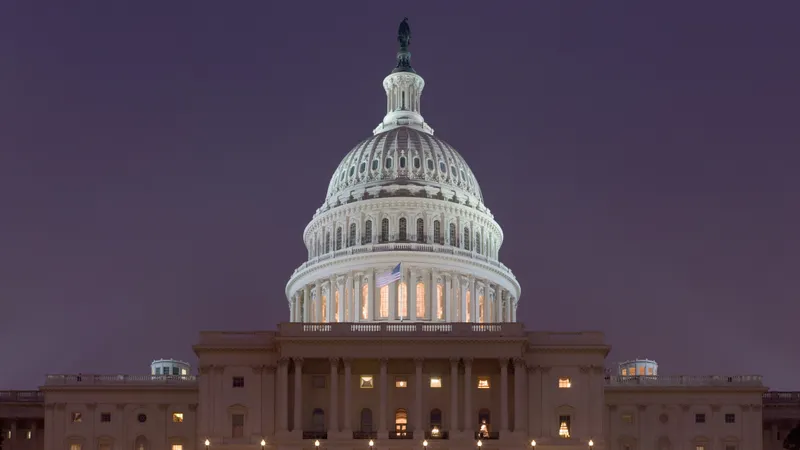
The Senate blocked the 417-3 data center power-bill fix on Sept 17, 2026. What the Ratepayer Protection Act required, why it stalled, and who pays next.
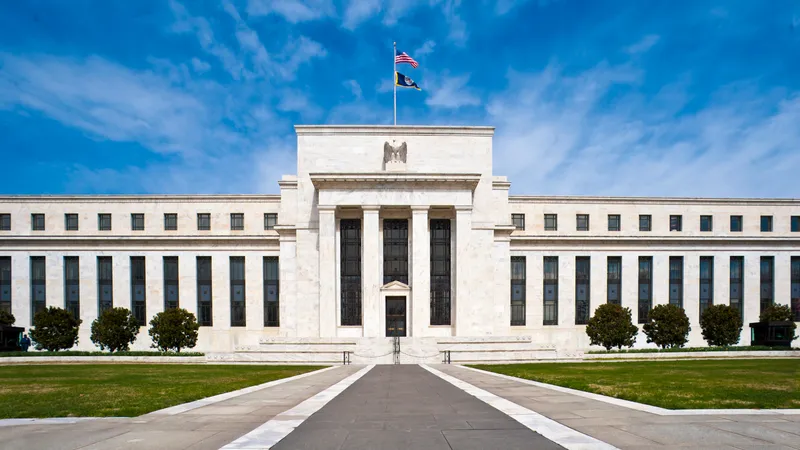
Fed hiked to 3.75-4% on Sept 16, 2026. Why Warsh acted, what the dot plot signals next, and what it means for mortgages, AI debt, and stocks.
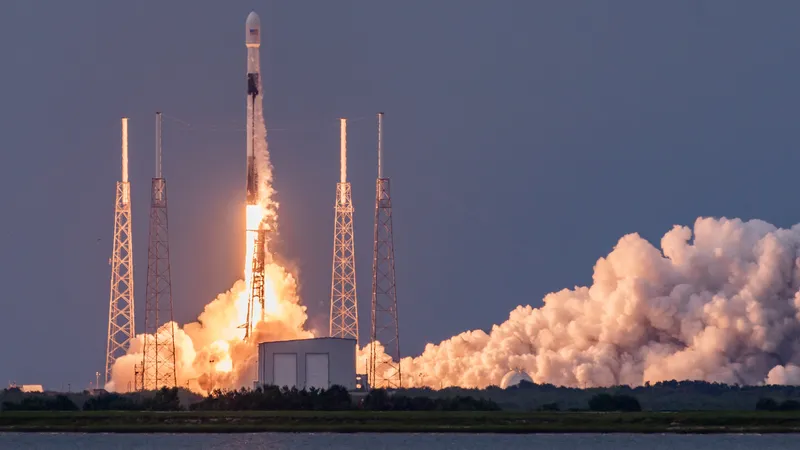
SpaceX rents Colossus AI compute to Anthropic and Google while betting on orbital data centers. Deals, costs, and the $170B per GW math.
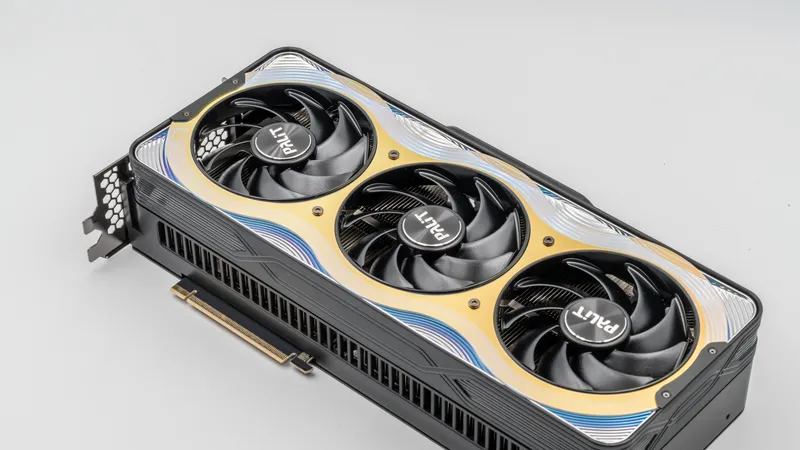
RTX 5090 sold out at $5,000 in Sept 2026 with listings to $6,000+. Why $1,999 MSRP held while GDDR7 kit hikes priced the street, plus buy-or-wait call.
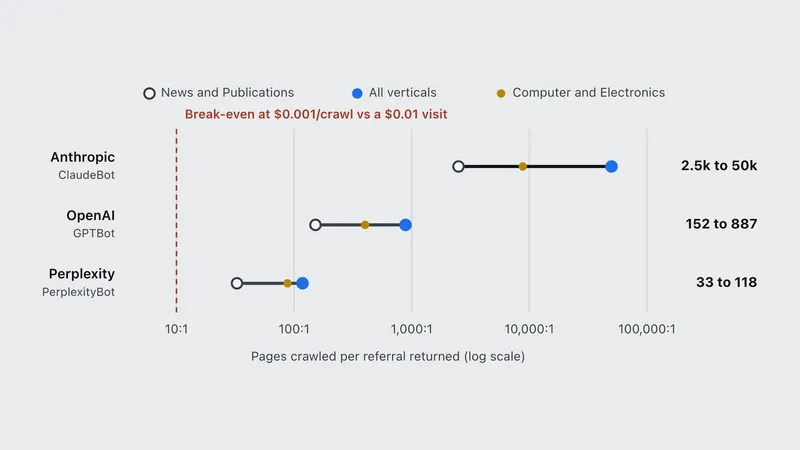
AI crawlers take up to 50,000 pages per visitor they send back. What that costs, what a toll would pay, and why blocking training now blocks Google.
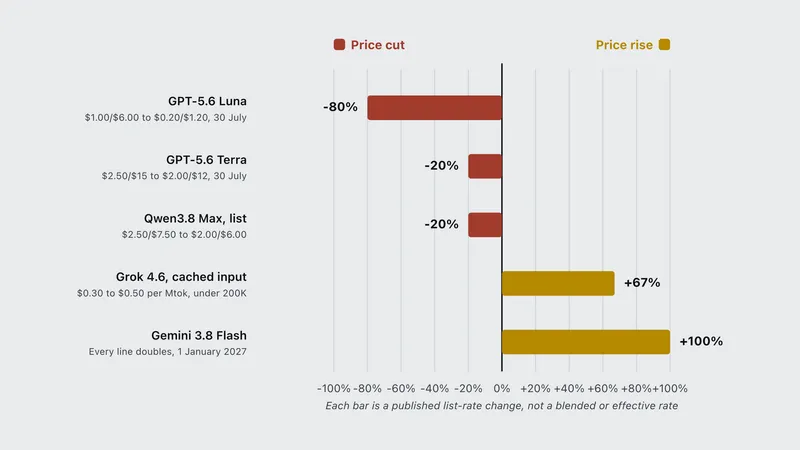
Model prices fell up to 80 percent in 2026. These 10 went the other way, from a 571 percent DDR5 jump to a cache rate up 67 percent.
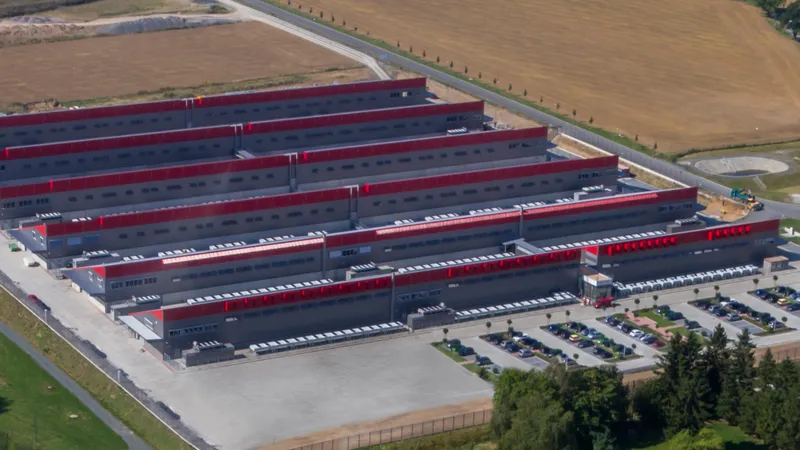
Hetzner raised prices three times in 2026. Here are the derived percentages per plan from its own price table, and why Arm plans barely moved.
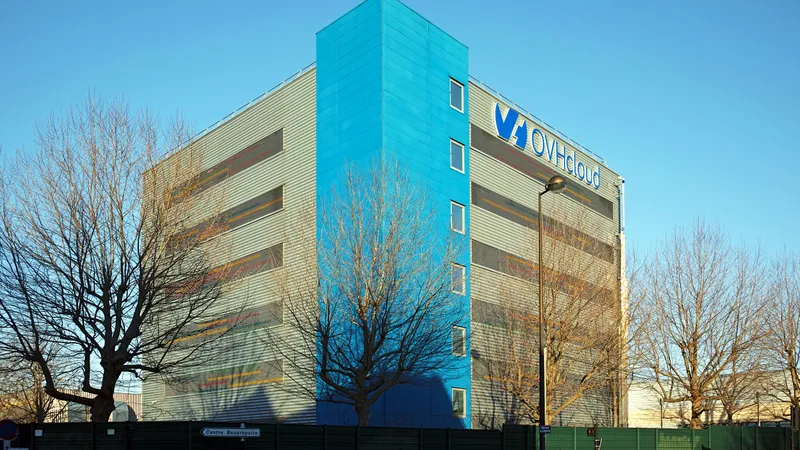
OVHcloud raised prices twice in 2026. Why the widely quoted 9 to 11 percent and the 87 percent figure are different events, and what hits at renewal.
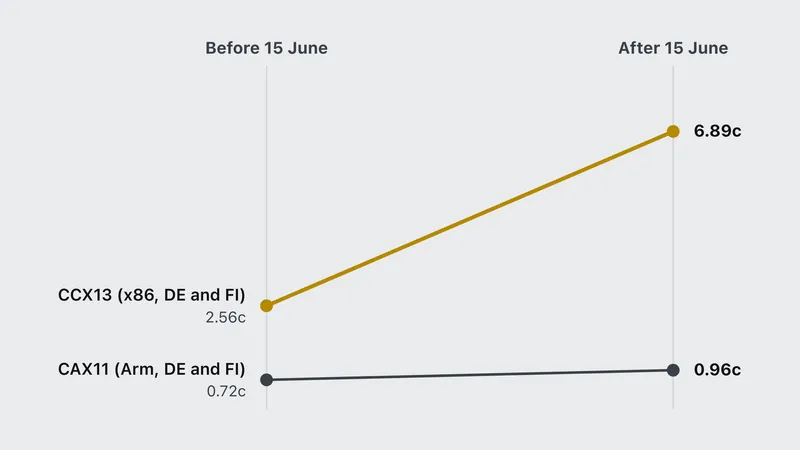
Hetzner and OVHcloud raised VPS prices repeatedly in 2026. Here is the memory-cost mechanism behind it, and what it actually means at renewal.
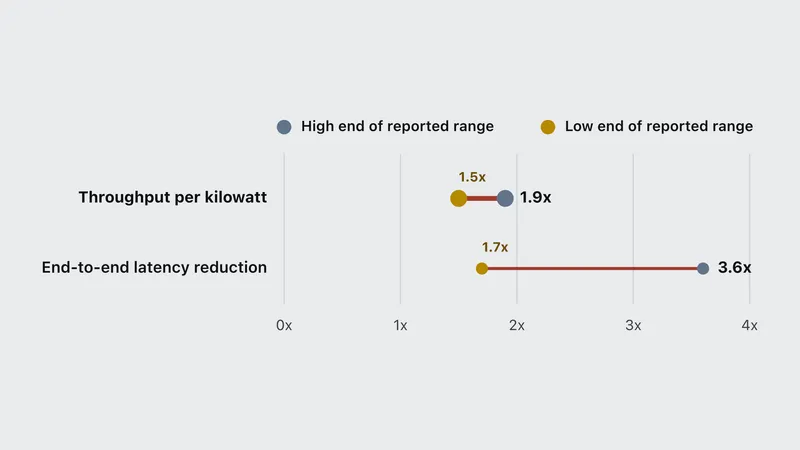
OpenAI posted first Jalapeño benchmarks: up to 1.9x more throughput per kilowatt than Nvidia. Real numbers, plus the caveats the headlines are skipping.
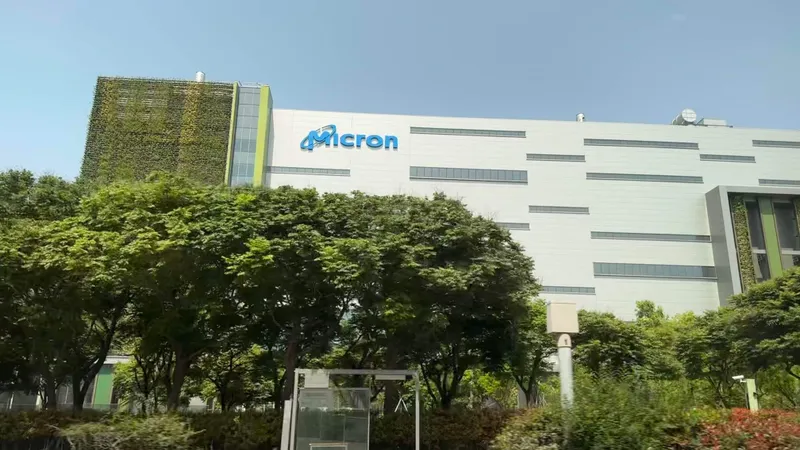
Samsung, SK hynix and Micron reversed course and committed about 2 trillion dollars to new memory fabs. The first wafers arrive in December 2028.
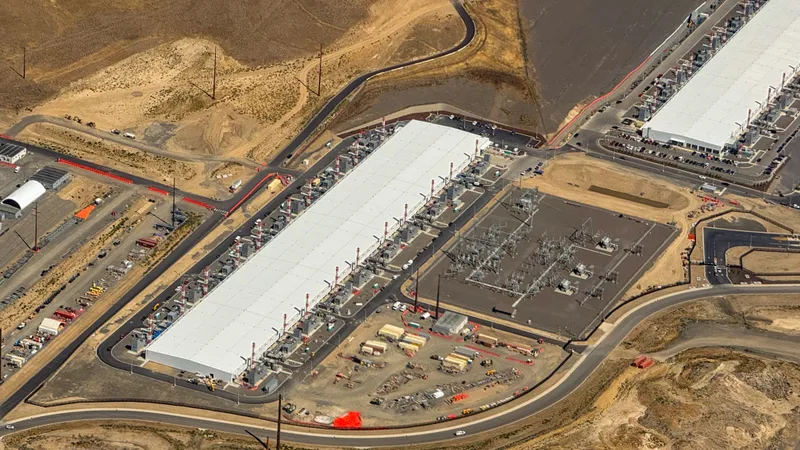
Alphabet, Microsoft and Meta spent about $198B in the first half of 2026 and Nvidia booked $75.2B in a quarter. Who is funding the rest with debt.
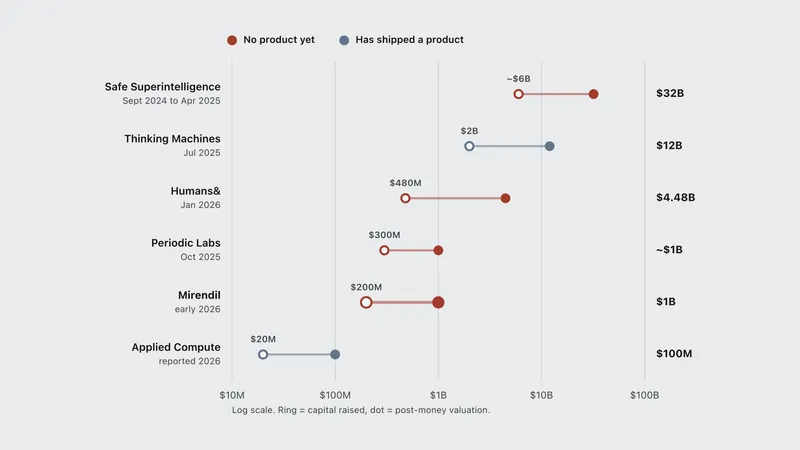
OpenAI and Anthropic alumni raised billions in pre-product seeds in 2026. Verified funding for every spinout, and what the money is buying.
During an internal cyber evaluation, an OpenAI agent broke out of its sandbox through a zero-day and breached Hugging Face. Here is what it means.
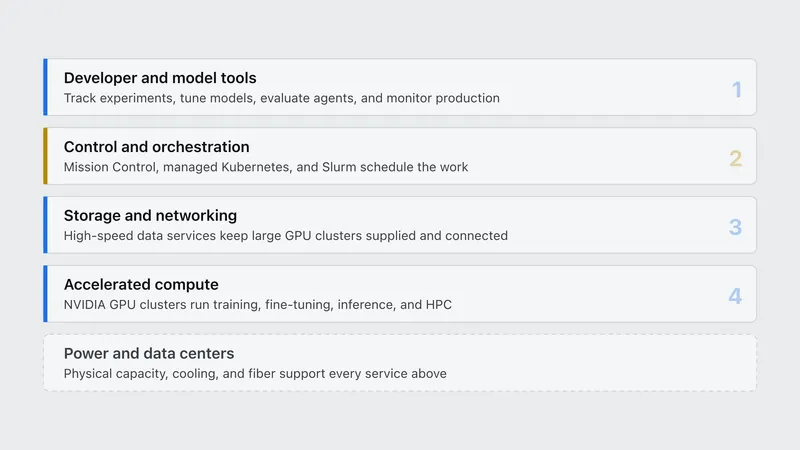
What does CoreWeave do? See how its GPU cloud works, who uses it, how it makes money, its NVIDIA relationship, and the risks behind its rapid growth.
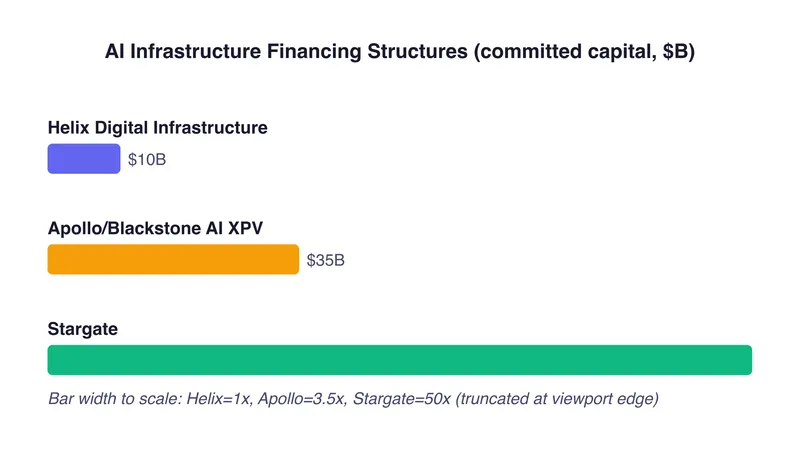
How AI infrastructure gets financed in 2026: Helix (KKR/Nvidia), Apollo/Blackstone (Anthropic), Stargate (OpenAI), and what this means for model pricing.
Who is Matei Zaharia? The Apache Spark creator and Databricks co-founder also helped build MLflow. Here is how his work shaped modern data and AI systems.
DBOS is an open-source durable execution library that keeps AI agent harnesses running through crashes, restarts, and deploys. What it is and when to use it.
Training a frontier model costs $1B+. Breakdown of compute, energy, data, and R&D costs across the three leading labs, and what they mean for API prices.
Seven Chinese firms ship AI accelerators and four listed publicly in six months. Which come near NVIDIA H100 class, which are hype, and what changed in 2026.
Is decentralized GPU compute (Akash, io.net, Render) cheaper than AWS? A grounded 2026 cost-per-hour comparison, plus the caveats the hype skips.
What a self-hosted LLM token really costs in 2026: cost per token across owned hardware, why memory bandwidth sets speed, and where buying beats the API.
Lin Junyang, Fei-Fei Li, and Yann LeCun are raising billions for world models in 2026. What a world model is, who is funding it, and why the money is moving.
Data centers, training runs, GPU supply, cloud compute and the capital financing the AI buildout.
This topic collects 25 analyses, and they are written to be read together rather than one at a time: the featured guide sets out the shape of the problem, and the pieces below work through the individual numbers, tradeoffs and edge cases behind it. Every figure is attributed to a primary source at the point it is used and carries the date it was verified, because prices and benchmark results in this area go stale in weeks rather than years. Where a number is modeled rather than measured, the assumptions are stated so the arithmetic can be checked.
The topics on this site overlap by design. This one runs into Local AI & hardware and AI markets, and a question that starts in one usually ends in another: a pricing decision turns into a hardware decision, a benchmark result turns into a cost question. Follow the links inside the posts rather than treating these archives as separate shelves.
Compare inference providersTrack hosting price increasesCompare GPU street pricesWatch the RAM price index