Claude Code Mods for Monitoring a Session: 8 We Built
The eight Claude Code mods we run above the prompt: live activity, context, repo, CI, recaps, memory, system and usage, with how each works and a code sketch.

The short answer. The best Claude Code mods for monitoring a session each answer one nagging question for free: what is running, how full the context is, which branch and PR you are on, whether memory loaded, why the laptop fan is screaming, and how much plan you have left. We built eight of them as one pack. Each one draws a numbered row above the prompt. Type the digit, and a pane slides open with the details.
Think of it as a car dashboard for Claude Code. You do not need to pop the hood to know you are low on fuel. You just glance down.
These are the mods we use every day while building this site. Below is each one, the problem it solves, and a short code sketch of how it hooks in. The sketches are trimmed on purpose: they show the trick, not the full source.
What is a Claude Code mod?
A mod is a plugin that changes how Claude Code looks and behaves: a few JavaScript or TypeScript functions that run right inside Claude Code. Anthropic launched mods on 1 October 2026 and describes them as “small TypeScript functions that change how Claude Code works.” According to the documentation, you need Claude Code v2.1.287 or newer, and mods are on out of the box.
Claude Code already had settings hooks, skills and MCP servers, so why bother? Mods add two things. They can remember what happened earlier in the session, and they can draw on screen: a pane next to the chat, or rows above the prompt. Everything in this post relies on that second one.
Looking for mods someone else built? Our guide to the best Claude Code mods and where to find them compares the directories and explains how to check a mod before you install it. This post covers building your own.
Why eight rows instead of one status line?
Claude Code’s status line is a single line of text produced by a script. We tried fitting the model, context, branch, CI and cost onto it, and it became too crowded to read at a glance.
So each concern got its own row:
- One row per job, numbered 1 to 8. Each row shows the one number you would act on, such as context 61%, CI 4/5 or 5h 15%.
- The number opens the detail. Type it into an empty prompt (or click the row) and that mod’s pane opens, with tabs for the detail.
- Controls are clickable. Arrows, toggles and model names respond to a click, so common changes take one tap.
- Every pane also has a slash command, such as
/ctxor/limits, for keyboard users and the Desktop app. - No tokens by default. Drawing a row is just code running on your machine. Claude never sees it.
Rows that change often (activity, context) are at the top. Rows you check now and then (system, usage) are at the bottom.
How is a mod put together?
Each mod is three small files, plus a shared UI kit:
activity/
├── .claude-plugin/plugin.json   # name, version, description
└── hooks/
    ├── hooks.json               # { "modules": ["./register.tsx"] }
    └── register.tsx             # the hooks
The mods live in the repository under .claude/skills/. Once you trust the workspace, Claude Code loads every folder there that holds a .claude-plugin/plugin.json, so nobody has to install anything. Each mod also checks which project it is running in and does nothing anywhere else.
Every hook has the same shape: on(event, matcher, ($, e, next) => ...). $ is the mods API, e is the event, and next(e) passes the event on to Claude Code. One rule applies to every mod here: watch and draw, but never block.
1. Live activity: what is Claude doing right now?
The problem: a long turn looks the same whether Claude is on its first tool call or stuck on its fortieth.
The row: a spinner and a count of what is running, or idle with how long the last turn took.
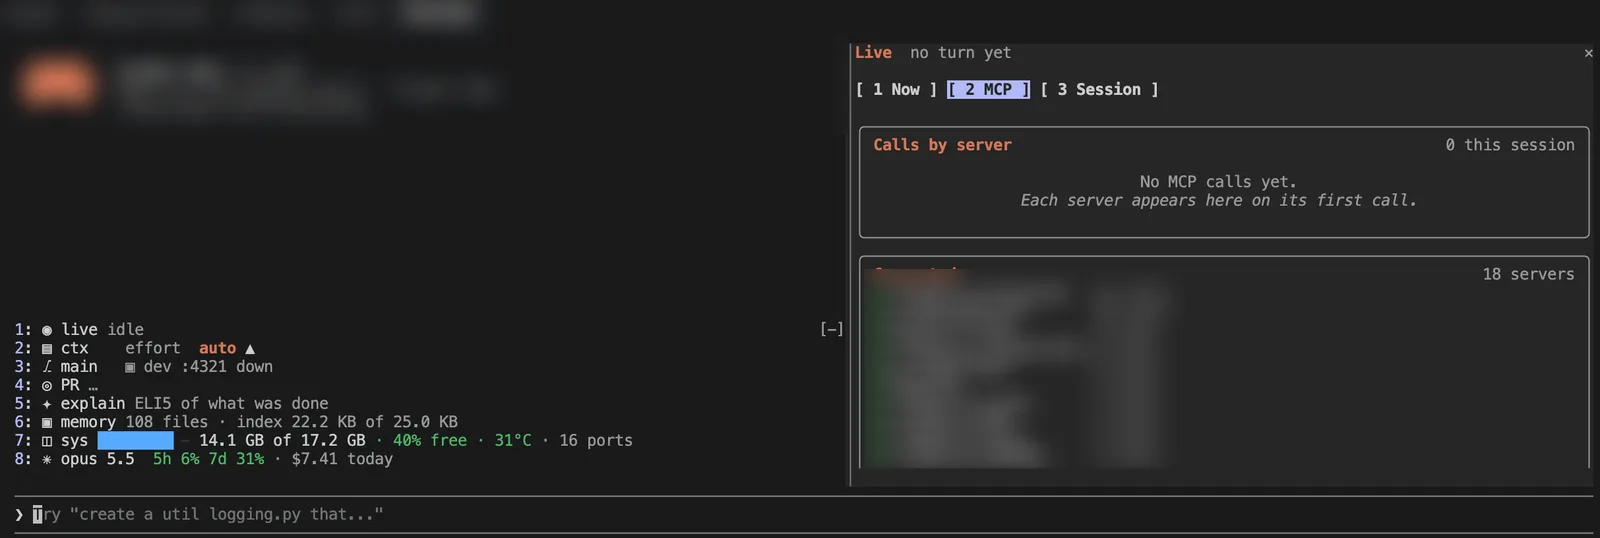
The pane (/running): three tabs. Now lists running tool calls with a timer on each, plus subagents and background shells. MCP counts calls per server and lists every connected server. Session counts skills and tool calls by name.
It works by timing every tool call. next(e) returns when the tool finishes, so the time in between is how long the tool ran:
on('tool.call', async ($, e, next) => {
  const id = start(e.tool); // record name + start time in module state
  $.ui.invalidate('ui.render'); // redraw the row now
  try {
    return await next(e); // let the tool run as usual
  } finally {
    finish(id); // move it to history with its duration
  }
});
What we learned: the MCP tab turned out to be the most useful. It showed connectors with dozens of tools that a blog repository never uses, and every one of those tools is sent with every request. The pane opens by itself when a session starts, but only if the terminal is wide enough to fit it.
2. Context meter: how full is the window, and how much effort is Claude using?
The problem: you usually find out the context is full when Claude compacts it, and by then you can no longer choose what to drop.
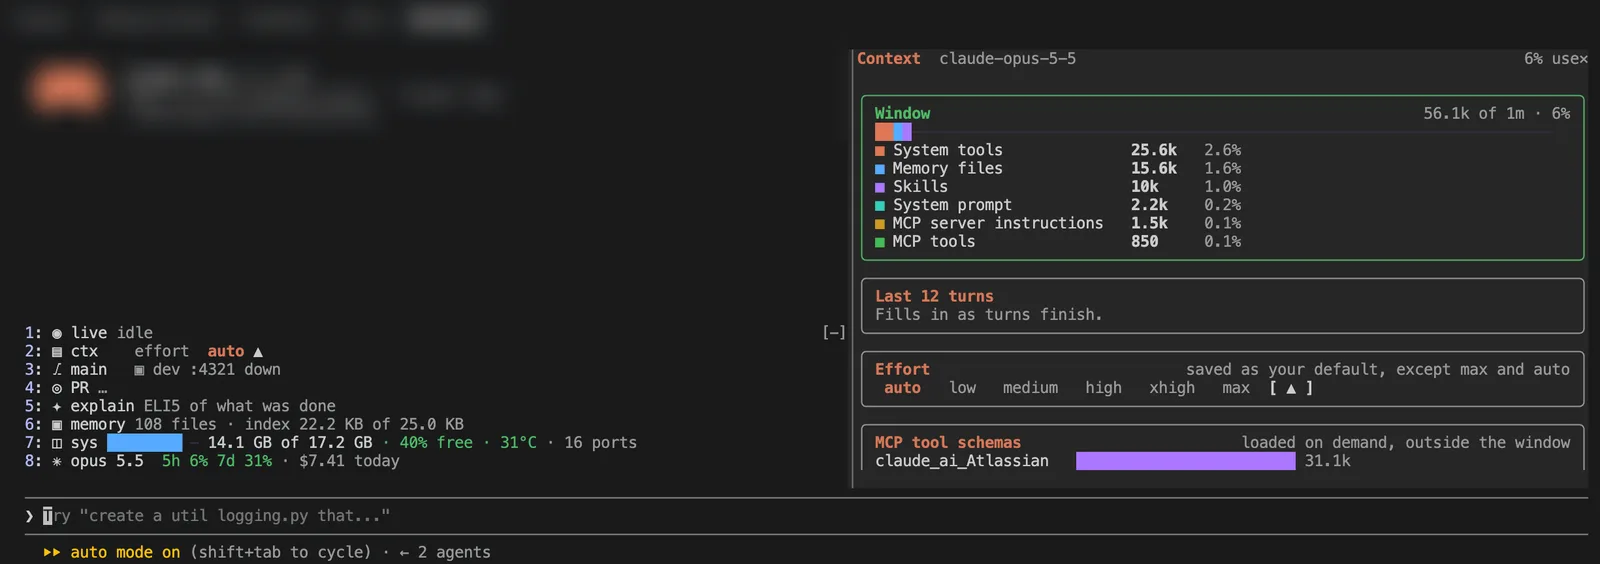
The row: context used as a percentage, a sparkline of the last 12 turns, and the effort level with an arrow on each side it can move: ▼ medium ▲, or just auto ▲ at the bottom of the ladder. Click ▼ to lower effort for quick tasks, or ▲ to raise it for harder ones. No need to type /effort.
The pane (/ctx): the window split by category (tools, memory files, skills, system prompt, MCP), the trend per turn, the full effort ladder, and how much the on-demand MCP tool schemas would add if loaded.
Claude Code sends fresh usage numbers as an event, so the mod never has to estimate:
on('session.measure', async ($, e, next) => {
  const r = await next(e);
  const usage = await $.session.usage(); // context use and plan limits
  pushTurn(contextPercent(usage)); // feeds the 12-turn sparkline
  $.ui.invalidate('ui.render');
  return r;
});
What we learned: the breakdown is more useful than the total. Before the first prompt, our window already held 56,000 tokens, and almost half of that was tool definitions. That is why we now trim MCP servers per project. It is the same cost problem covered in how many tokens AI coding agents burn.
3. Repo state: which branch, issue and PR am I on?
The problem: you and Claude can lose track of where you are. You have switched to the feature branch, but Claude is still working as if you were on main.
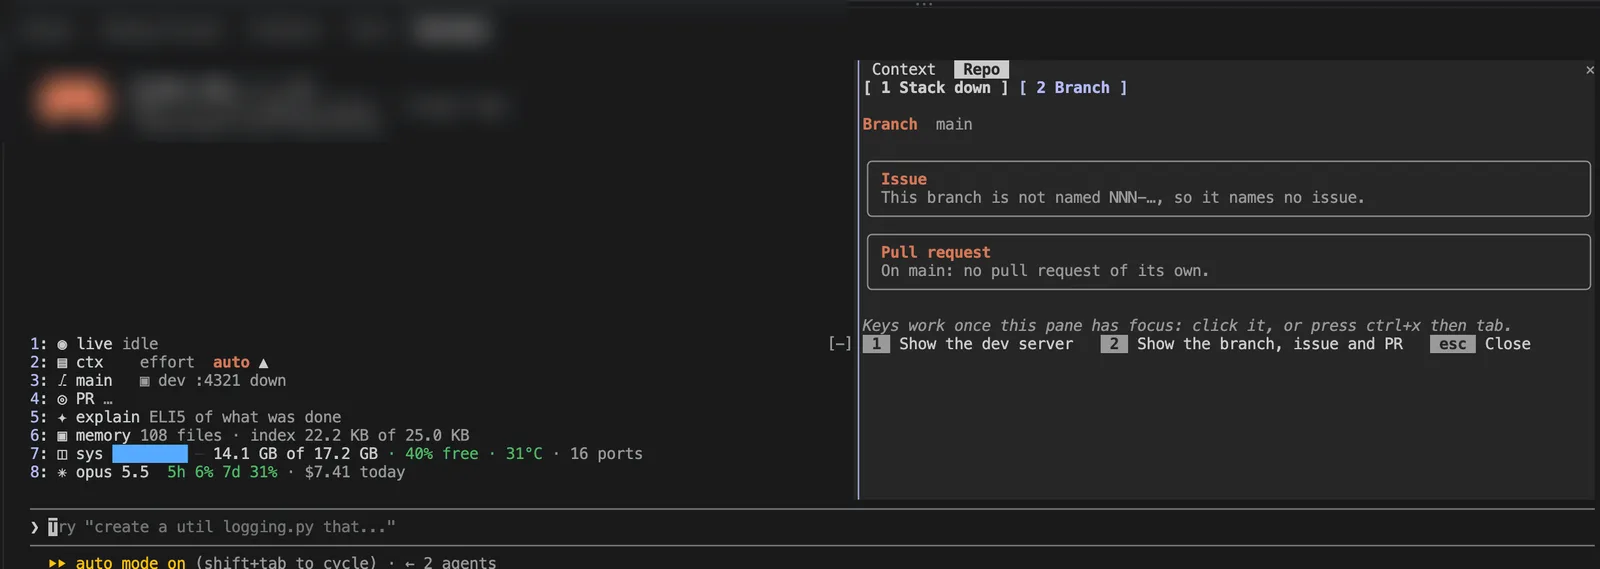
The row: the branch, the issue it refers to (our branch names start with the issue number), the PR if there is one, and whether the dev server is running.
The pane (/stack): a Stack tab that starts and stops pnpm dev with one key, and a Branch tab with the issue and PR titles.
This is the part worth copying. The mod does not only show you the facts, it also passes them to Claude:
on('prompt.compose', async ($, e, next) => {
  const facts = await repoFacts($); // branch, issue, PR, dev server, cached
  if (!facts) return next(e);
  return next(withSection(e, `Repo state: ${facts}`)); // append, never replace
});
What we learned: a few dozen tokens of facts in the system prompt is the cheapest way we know to avoid “which branch is this?” mistakes. Local state is refreshed every 30 seconds and after any Bash call. Anything that needs GitHub is refreshed every five minutes, because gh is slow and rate-limited.
4. PR and CI: are the checks green, and who is waiting on me?
The problem: you switch to the browser to watch the checks, and miss a review comment that arrives in the meantime.
The row: something like PR #42 draft · CI 4/5 · 2 threads.
The pane (/ci, /threads): a Checks tab with each check’s state, duration and log link, and a Threads tab listing unresolved review threads where someone else replied last.
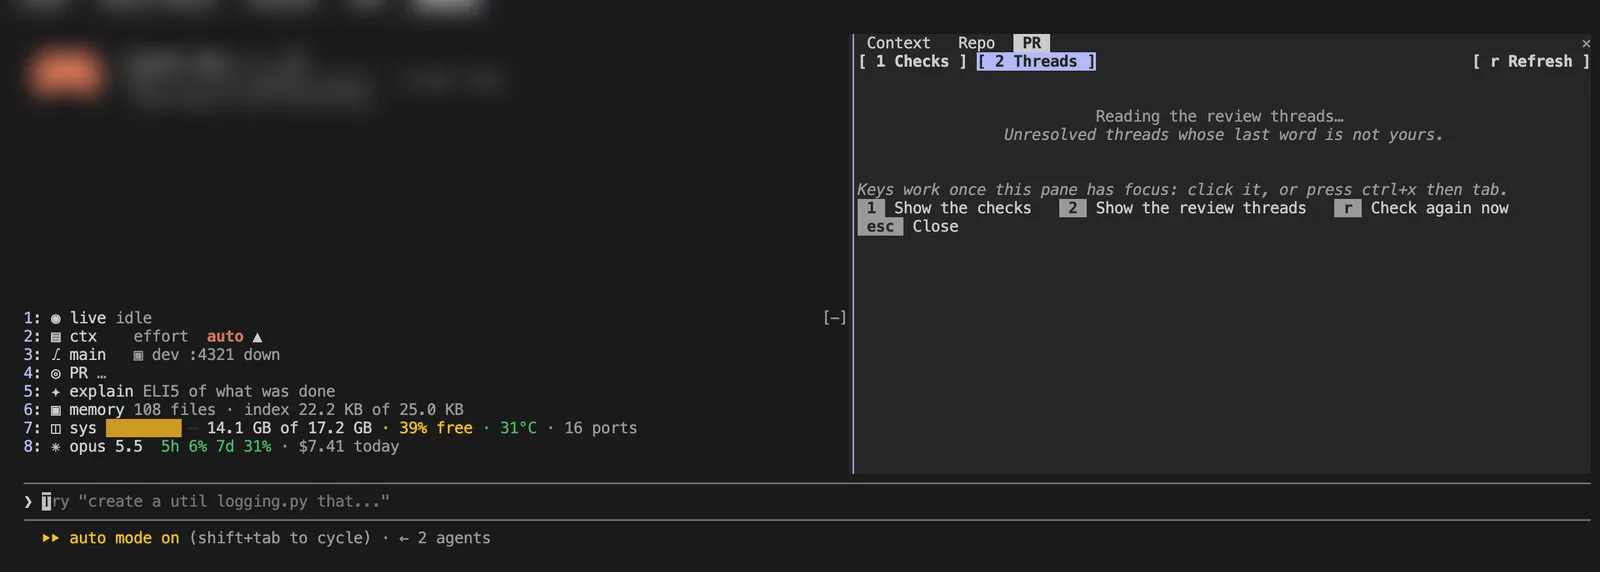
The data comes from the GitHub CLI, run through the mods API, which uses no shell and does not throw on a failed exit code:
const r = await $.process.run(['gh', 'pr', 'checks', '--json', 'name,state,bucket']);
const checks = r.exitCode === 0 ? JSON.parse(r.stdout) : [];
$.ui.status(`CI ${passed(checks)}/${checks.length}`);
What we learned: two details made this one worth keeping. /ci switches to faster polling and shows a notification as each check finishes, so you do not have to keep watching. And the mod registers the threads as a tool Claude can call, so asking Claude to “fix the open review comments” just works. A failed gh call shows up as a line of text in the pane rather than a crash, because a monitoring mod that breaks your session is worse than none.
5. Explain: what just happened, in plain words?
The problem: a long turn ends with a wall of tool calls, when all you want is a short summary of what changed and what to check.
The row: explain, a reminder that it gives a plain-language recap.
The pane (/explain): a recap of the last turn or the whole session under four fixed headings (what you asked, what was done, what to check next, one-sentence summary), the list of changed files from git, and one-key follow-ups such as “explain that more simply.”
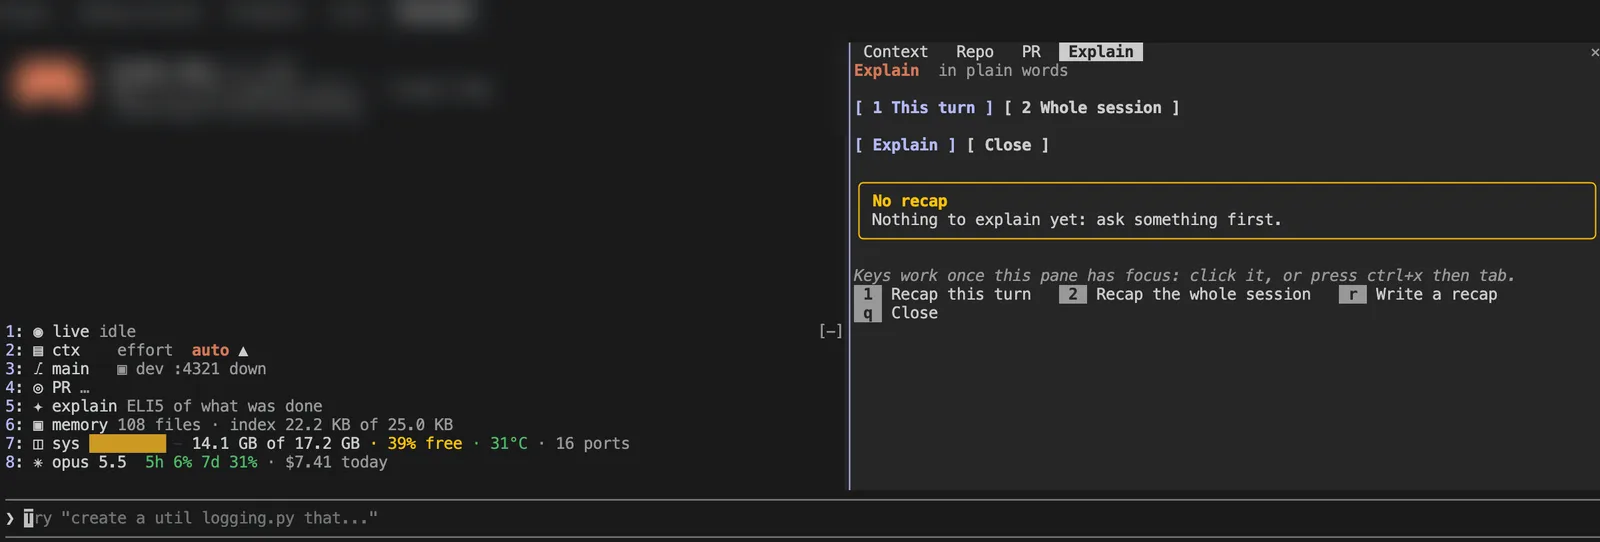
This is the only mod that calls a model. It uses $.model.fork, which according to the mods API documentation asks a side question about the current conversation with the same model and system prompt, so most of it is served from the prompt cache. The main chat never sees the question or the answer:
const r = await $.model.fork({
  prompt:
    'Recap the last turn for someone who never saw the code. ' +
    'Headings: What you asked / What I did / What to check next / In one sentence. ' +
    'Do not call tools.',
});
if (r.isAnswered) saveRecap(r.text);
What we learned: a fork is much cheaper than a fresh model call, which would need the whole transcript sent again at full price. Pressing 5 only shows the latest recap. A new one is written only when you ask for it, so looking costs nothing.
6. Memory: is my memory index actually loading?
The problem: auto memory loads only the first 200 lines or 25KB of MEMORY.md, whichever comes first, according to Claude Code’s memory documentation. Anything past that is dropped without a warning, and Claude simply stops remembering it.
The row: the number of memory files and the index size against the 25KB limit.
The pane (/memory-files): an Index tab that marks each line as loaded or cut, a Files tab grouped by type, and a Read tab for viewing one file.
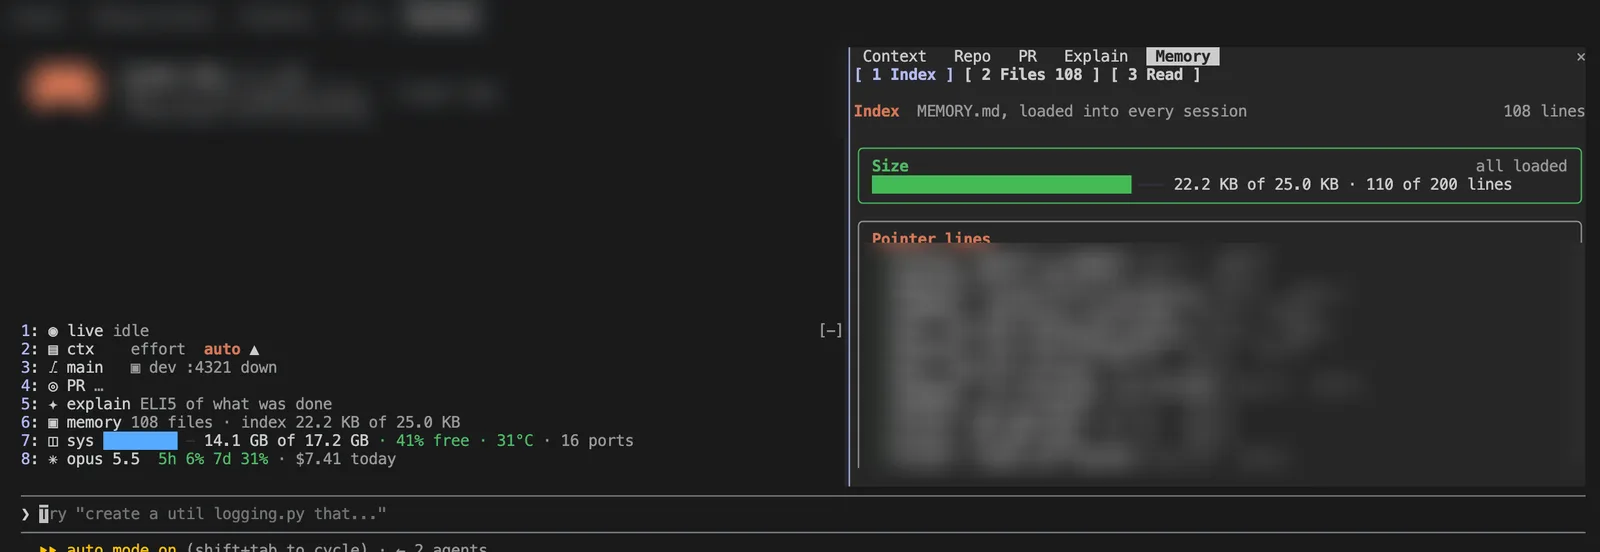
The check itself is one file read and two comparisons:
const text = await $.fs.read(indexPath); // ~/.claude/projects/<project>/memory/MEMORY.md
const bytes = new TextEncoder().encode(text).length;
const lines = text.split('\n').length;
const cut = bytes > 25_000 || lines > 200;
What we learned: this mod alone justified building the set. Our index was at 22.2KB of 25KB. Without this row, the first sign of trouble would have been Claude ignoring a rule it had followed for months, and we would probably have blamed the model. The mod is read-only on purpose: it shows the problem and leaves the cleanup to you.
7. System: is my machine the bottleneck?
The problem: with five Claude sessions, two dev servers and a browser open on a 16GB laptop, everything slows down, and you want to know which process to close.
The row: RAM used out of total, free memory, temperature, and how many ports are listening.
The pane (/system, /ports): a RAM tab with the same breakdown Activity Monitor shows and the biggest processes, and a Ports tab listing every TCP listener and the folder it runs from. Every row has a Kill button.
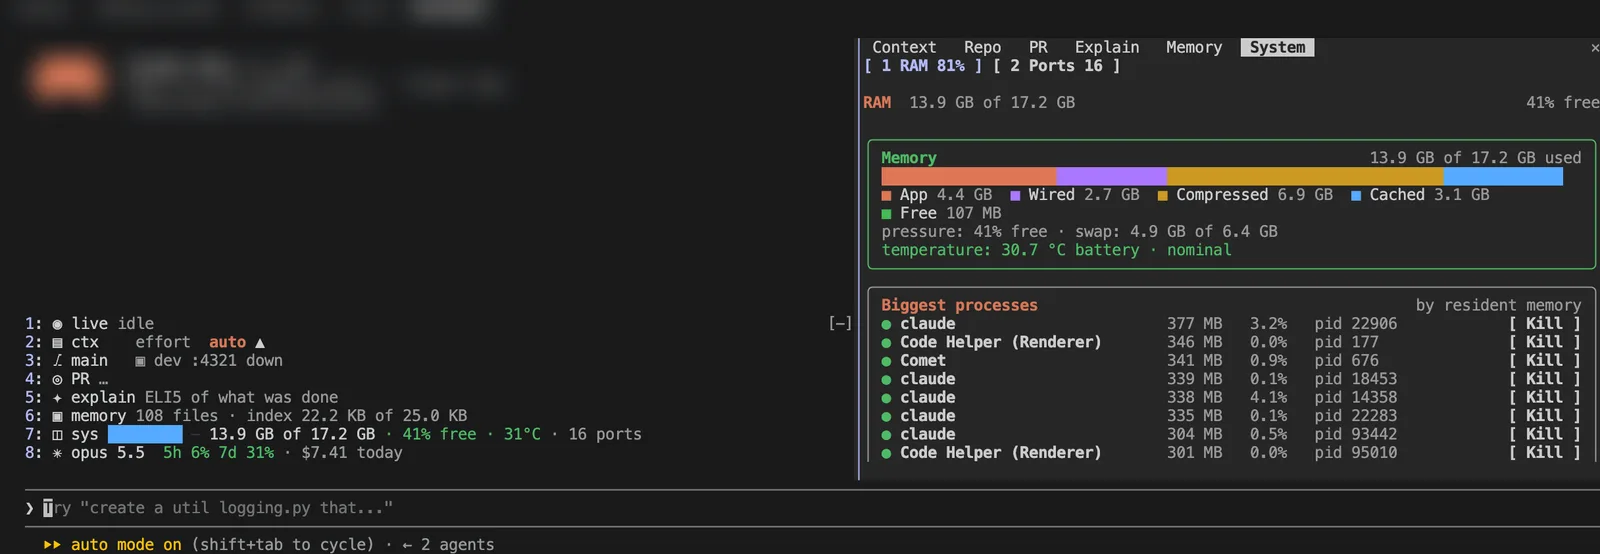
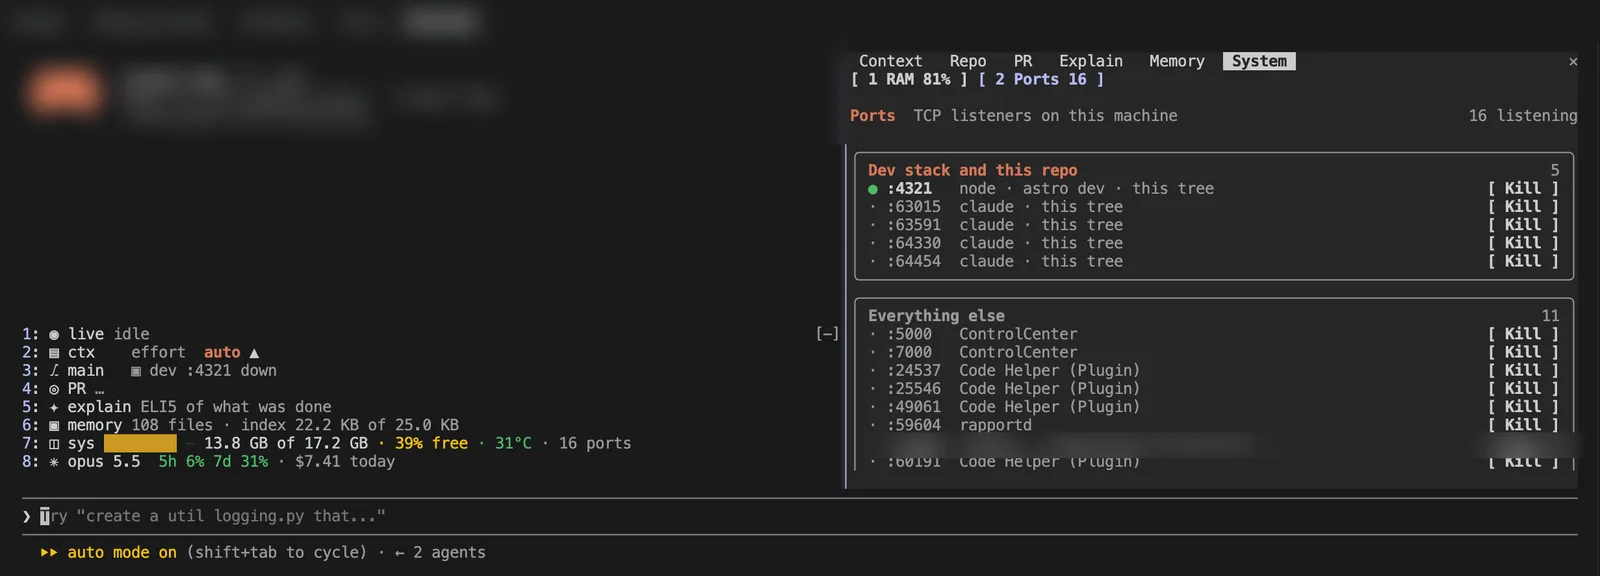
The readings come from standard OS commands (vm_stat, ps, lsof on macOS), run every five seconds, with the heavier ones every sixth pass. Most of the care goes into the Kill button, so a mod can never stop its own session:
async function kill($, pid) {
  if (isOwnSessionOrAncestor(pid) || isSystem(pid)) return; // never offered
  if (!(await confirm($, `Stop ${name(pid)}?`))) return;
  await $.process.run(['kill', '-TERM', String(pid)]);
  await $.clock.sleep(3000);
  if (alive(pid) && (await confirm($, 'Still running. Force it?')))
    await $.process.run(['kill', '-KILL', String(pid)]);
}
What we learned: five of the eight largest processes on the machine were Claude sessions, at 300 to 380MB each. The Ports tab gets used the most, though. When :4321 is “already in use,” it is almost always a dev server that an earlier session left running.
8. Usage and model: how much plan is left, and which model am I on?
The problem: you only notice the 5-hour and 7-day limits when you hit them, and the day’s cost is spread across several sessions.
The row: the current model, the 5h and 7d window percentages, and today’s cost.
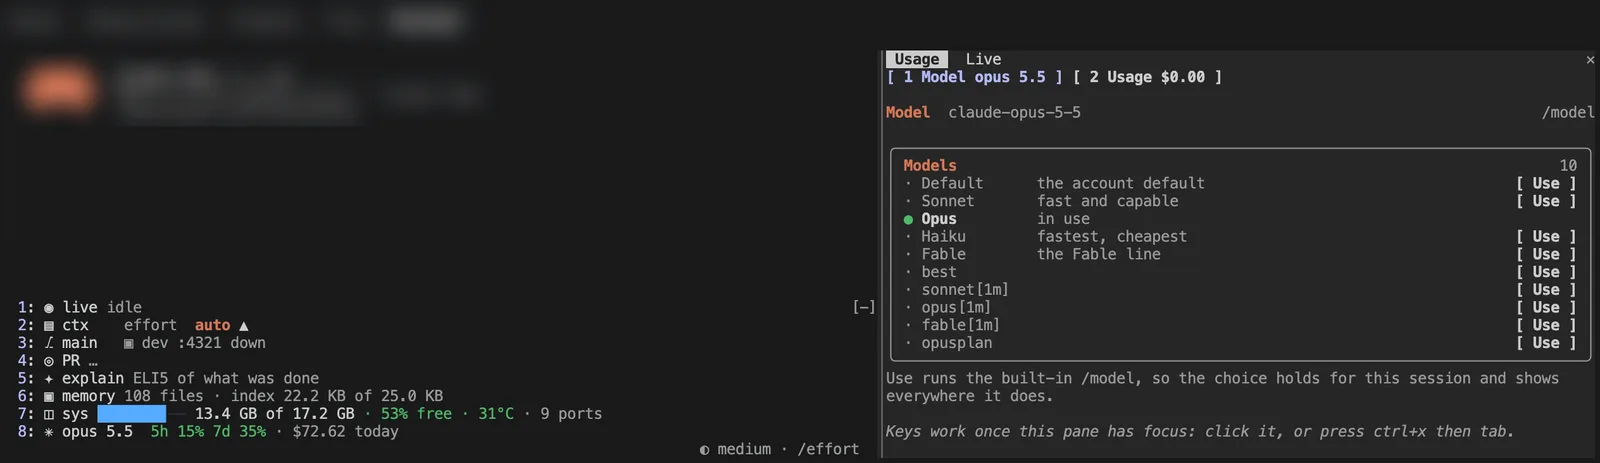
The pane (/models, /limits): two tabs. The Model tab (pictured at the top of this post) lists every model with a Use button. Clicking it runs the built-in /model for you, so the choice holds for the session and shows everywhere /model does. The Usage tab has a meter per window, its reset time, today’s cost and a 14-day sparkline.
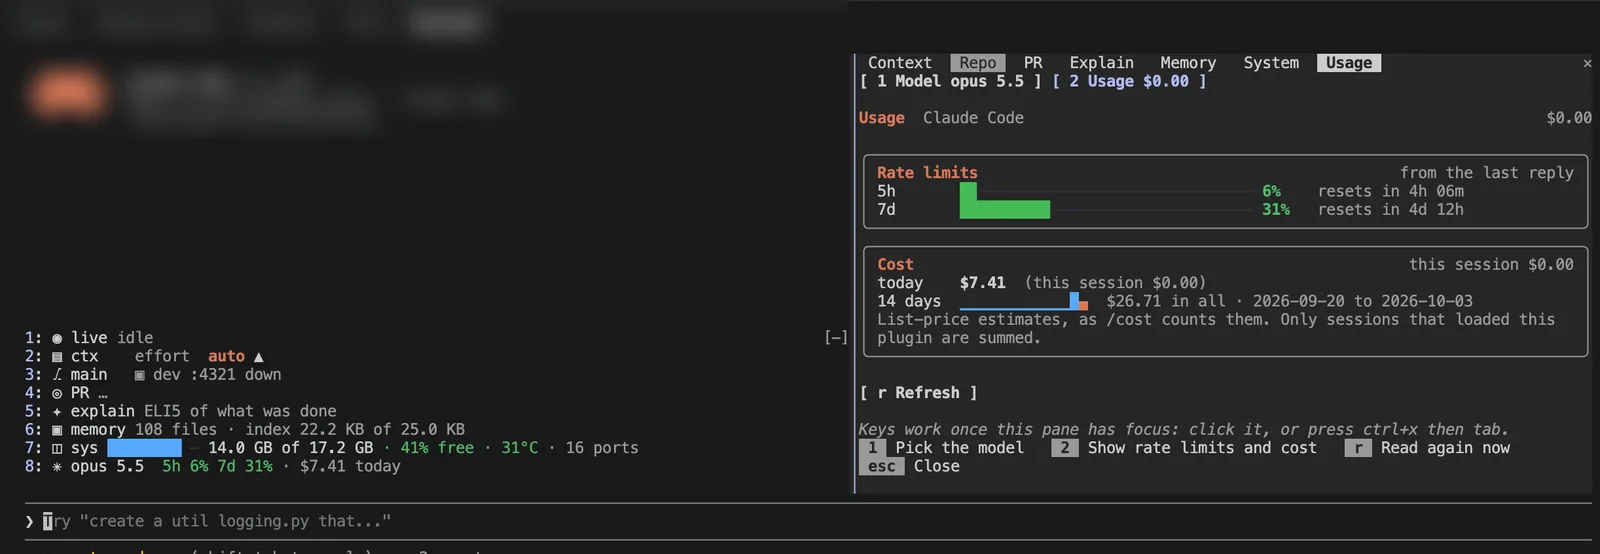
Each session saves its own cost under a per-day key, so today’s total adds up across every open session:
const day = dayKey(await $.clock.now()); // local date, so midnight rolls over cleanly
await saveCost($, `cost:${day}:${sessionId}`, sessionCost); // $.store, one key per session
const todayTotal = await sumCosts($, day); // every session's key for today
What we learned: two things. First, the command is /limits rather than /usage, because a mod cannot register a built-in command name: the registration throws, and the rest of that hook never runs. Second, the Model tab warns you before switching once the context passes 50,000 tokens. A new model cannot reuse the previous model’s prompt cache, so the next request sends the whole context again at full price. The costs are list-price estimates, the same numbers /cost shows, and our explainer on the /cost command covers what they mean on a subscription.
What should you know before building your own?
Two more things to know. The mods API is the only way a mod can reach the outside world: there is no Node, no setTimeout and no direct file access, so timers go through $.clock and files through $.fs. And $ cannot be passed through an import, so shared helpers take it as an argument. We copied one small UI kit (tabs, cards, meters, sparklines, buttons) into each mod so every pane looks consistent.
How do you start your own monitoring mod?
Start small, with a single row above the prompt. Create the three files from the layout above, then begin register.tsx like this:
let calls = 0;

export const register = (on) => {
  on('tool.call', async ($, e, next) => {
    calls += 1;
    $.ui.invalidate('ui.render');
    return next(e);
  });
  on('ui.render', { component: 'AbovePrompt' }, async ($, e, next) => {
    const below = await next(e);
    return [row(`tools this session: ${calls}`), below]; // row(): your own drawing helper
  });
};
Load it for a single session with claude --plugin-dir ./your-mod, run claude plugin validate ./your-mod to see which events and calls it declares, and build from there. For example code, Anthropic’s sample mods (token-weather draws a context forecast above the prompt) and the built-in mods’ source are the best references. You can also describe the mod you want in a session and let Claude write it with the bundled plugin-authoring skill.
Not sure whether a feature should be a mod, a settings hook, a skill or an MCP server? Start with our Claude Code harness guide, then see how the pieces fit together in our own Claude Code harness.
Frequently asked questions
- Do Claude Code monitoring mods cost tokens?
- Not unless they call a model. A mod runs as code inside Claude Code, so reading events, running git or gh, and drawing a pane use no tokens. Of the mods in this post, only Explain calls a model, through $.model.fork, and only when you press its key.
- Can a mod change the effort level or model with a click?
- Yes. In these mods the context row shows the effort level with arrows that step it up or down with a click, and the Model tab behind row 8 switches models by running the built-in /model command for you.
- What is the difference between a Claude Code mod and a status line?
- A status line is one line of text produced by a script you set in settings.json. A mod runs inside Claude Code, keeps state between events and can draw rows above the prompt and full panes with tabs and buttons. A mod can also set a status line of its own with $.ui.status.
- Which Claude Code version do mods need?
- Claude Code v2.1.287 or later, where mods are on by default. The screenshots in this post were taken on v2.1.288.
- Can a mod see how full the context window is?
- Yes. Claude Code fires a session.measure event with fresh usage, and $.session.usage() returns context window use and plan limits. The context meter and usage mods both read those numbers rather than estimating them.
- Are the mods in this post open source?
- Not at the moment. This post explains how each one works and shows simplified sketches of the patterns, which are enough to build your own version with the mods API.
Sources
- Anthropic (2026). Customize Claude Code with mods in TypeScript. Claude blog. https://claude.com/blog/claude-code-mods
- Anthropic (2026). Mods overview. Claude Code documentation. https://code.claude.com/docs/en/plugins/mods/overview
- Anthropic (2026). Use the mods API. Claude Code documentation. https://code.claude.com/docs/en/plugins/mods/api
- Anthropic (2026). How Claude remembers your project. Claude Code documentation. https://code.claude.com/docs/en/memory
- Anthropic (2026). Customize your status line. Claude Code documentation. https://code.claude.com/docs/en/statusline
- Anthropic (2026). claude-code-playground: sample mods. GitHub. https://github.com/anthropics/claude-code-playground/tree/main/claude-code/mods